Distributed request tracing is a popular method for monitoring distributed systems because it allows you to see the specific execution stages of any request, such as calls to other services and databases. However, the costs of integrating can be significantly high, since it requires changing the code of every component. Additionally, it's practically impossible to achieve 100% coverage, due to the fact that many third-party components don't support such instrumentation.
To address said disadvantages, we implemented eBPF-based container tracing which is a part of our open source Prometheus exporter node-agent. It passively monitors all TCP connections on a node, associates every connection with the related container, and exports metrics in Prometheus format:
# HELP container_net_tcp_successful_connects_total Total number of successful TCP connects
# TYPE container_net_tcp_successful_connects_total counter
container_net_tcp_successful_connects_total{actual_destination="10.128.0.43:443",container_id="/k8s/default/prometheus-0/prometheus-server",destination="10.52.0.1:443"} 2

# HELP container_net_tcp_active_connections Number of active outbound connections used by the container
# TYPE container_net_tcp_active_connections gauge
container_net_tcp_active_connections{actual_destination="10.128.0.43:443",container_id="/k8s/default/prometheus-0/prometheus-server",destination="10.52.0.1:443"} 1

# HELP container_net_tcp_failed_connects_total Total number of failed TCP connects
# TYPE container_net_tcp_failed_connects_total counter
container_net_tcp_failed_connects_total{container_id="/k8s/kube-system/konnectivity-agent-56cdbd78f-f7r7j/konnectivity-agent",destination="10.48.2.2:10250"} 20

# HELP container_net_tcp_listen_info Listen address of the container
# TYPE container_net_tcp_listen_info gauge
container_net_tcp_listen_info{container_id="/k8s/default/paymentservice-5849646947-b744v/server",listen_addr="10.48.0.4:50051",proxy=""} 1
These metrics are obtained using the sock:inet_sock_set_state kernel tracepoint. As the name implies, this tracepoint is called whenever a TCP connection changes its state.
Connection establishing
First, let's recall the TCP state transitions while establishing an outbound connection:

As seen in the diagram, a connection can be considered successfully established if the transition SYN_SENT -> ESTABLISHED has occurred. Conversely, SYN_SENT -> CLOSED means a failed connection attempt. Now, the tricky thing is that an eBPF program can only get the PID of the connection initiator during the CLOSED -> SYN_SENT transition. The solution for that is saving the initiator's PID to a kernel space map using the socket's pointer as a key, then we can use it on further transitions.
// saving the connection initiator's PID
if (args.oldstate == BPF_TCP_CLOSE && args.newstate == BPF_TCP_SYN_SENT) {
    struct sk_info i = {};
    i.pid = bpf_get_current_pid_tgid() >> 32;
    bpf_map_update_elem(&sk_info, &args.skaddr, &i, BPF_ANY);
    return 0;
}

...

//getting the PID
__u32 pid = 0;
struct sk_info *i = bpf_map_lookup_elem(&sk_info, &args.skaddr);
if (!i) {
    return 0;
}
pid = i->pid;
bpf_map_delete_elem(&sk_info, &args.skaddr);
The full source code of the inet_sock_set_state handler can be found here.
Connection closing
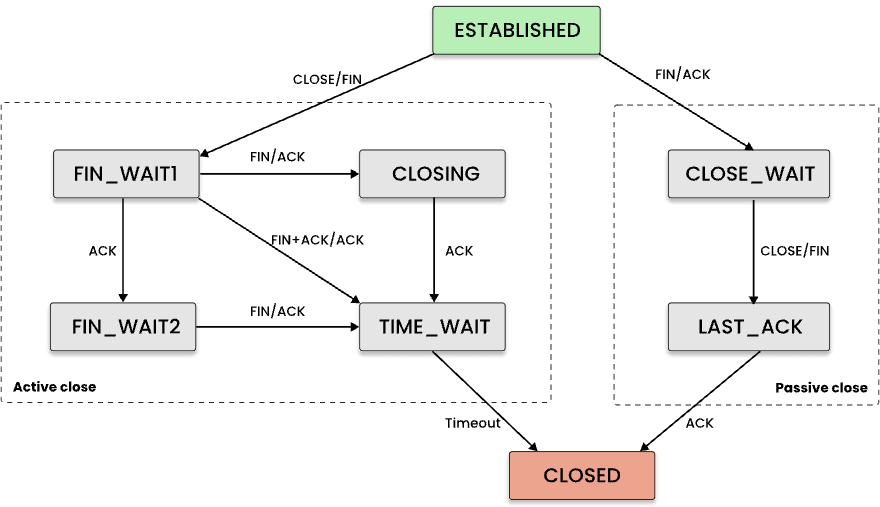
Depending on which peer closes the connection, either an ESTABLISHED -> FIN_WAIT1 (active close) or an ESTABLISHED -> CLOSE_WAIT (passive close) transition will occur. The only thing worth noting here is that we cannot get a PID when it's in a passive close, so we decided to resolve this in the userspace code. Since the handler does not need to differentiate between active and passive closes, it triggers in both cases.
if (args.oldstate == BPF_TCP_ESTABLISHED && (args.newstate == BPF_TCP_FIN_WAIT1 || args.newstate == BPF_TCP_CLOSE_WAIT)) {
    pid = 0;
    type = EVENT_TYPE_CONNECTION_CLOSE;
}
TCP LISTEN
In addition to outgoing connection tracing, we need to discover all listening sockets and containers associated with them. This can also be done by handling the CLOSED -> LISTEN and LISTEN -> CLOSED transitions. The initiator's PID is available in both cases.
if (args.oldstate == BPF_TCP_CLOSE && args.newstate == BPF_TCP_LISTEN) {
    type = EVENT_TYPE_LISTEN_OPEN;
}
if (args.oldstate == BPF_TCP_LISTEN && args.newstate == BPF_TCP_CLOSE) {
    type = EVENT_TYPE_LISTEN_CLOSE;
}
If the IP address of a listen socket is unspecified (0.0.0.0) the agent replaces it with the IP addresses assigned to the corresponding network namespace.
Network Address Translation (NAT)
Each event sent by the eBPF-program to the agent contains the source and destination IP:PORT pairs. However, the destination address can be virtual, as in the case of Kubernetes services. In this case, ClusterIP of the service will be replaced by the IP of a particular Pod by iptables or IPVS.
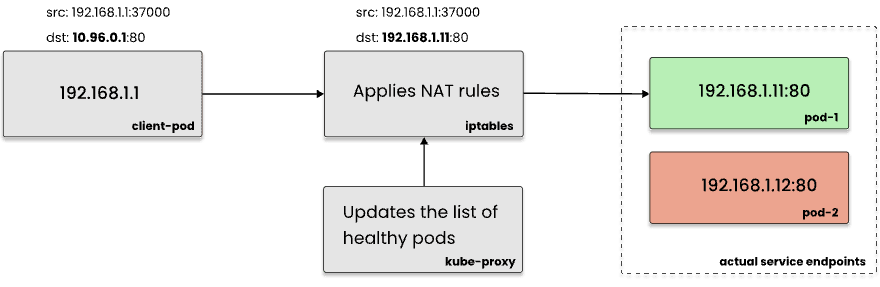
Since we need to know the services that each container interacted with as well as the specific containers involved in this interaction, the agent resolves the actual destination of each connection by querying the conntrack table using the Netlink protocol. As a result, each metric contains both destination and actual_destination labels:
{destination="10.96.0.1:80", actual_destination="192.168.1.11:80", container_id="/k8s/default/client-pod/server"}
Initialization
In addition to being notified of every new connection, the agent needs to detect all connections that were established before it started. To do this, it reads the information about the established connections from /proc/net/tcp and /proc/net/tcp6 in each network namespace on startup. The inode of each connection from these files is mapped with /proc/<pid>/fd to find the corresponding container.
How we use these metrics
- The
container_net_tcp_successful_connects_totalandcontainer_net_tcp_active_connectionsmetrics show whichIP:PORTeach container is communicating with. - The
container_net_tcp_listen_infometric shows on whichIP:PORTeach container is accepting inbound TCP connections. So, joining these metrics byIP:PORTallows us to build a map of container-to-container communications.

To build a map of service-to-service communications, Coroot aggregates individual containers into applications, such as Deployments or StatefulSets by using metrics from the kube-state-metrics exporter.

A service map like this can give you an overview of the distributed system architecture.
Here I've only described a portion of the network metrics needed to build a service map. Next time we will talk about metrics, which are extremely useful for troubleshooting network-related issues. Stay tuned!
Useful links
- node-agent (Apache-2.0 License)
- Upstream Service Inspection
- Try Coroot for free (14-day trial)


Top comments (0)