
Intro
I have recently learned python pipeline. It is very useful especially for the readability of the technical notebook and for the overall coding. However, I have encountered a big trouble that is bringing out the attributes of elements included in the pipeline.
With aid from my instructor and googling, the trouble turned into a valuable experience of learning something new.
Data
Let me briefly go over what data has been used for this post. The data is from National 2009 H1N1 Flu Survey. The link will direct you to the page where you can see variable names. The purpose of the survey is to study the H1N1 flu vaccination rate and the categories of respondents. This is just to help you to understand the output of the pipeline later in this post.
Elements in the Pipeline
The elements are actually called "steps" in the pipeline. Each step can be an encoder, sampling, or any machine learning (classification, regression, etc.). In the steps, OneHotEncoder as an encoder and RandomForestClassifier as a classifier are used.
Attributes
OneHotEncoder
Below is the python code to instantiate the encoder. Results will be put all together at the end of the post for a better organization.
# import libraries for columns transformation
from sklearn.preprocessing import OneHotEncoder
from sklearn.compose import ColumnTransformer

# instantiate encoders
ohe = OneHotEncoder(sparse=False, handle_unknown='ignore')

# apply encoding to just one column in the data
# to reduce complexity in the results
ct = ColumnTransformer([('age', ohe, ['age_group'])],
                       remainder='passthrough')
Please remember ct as it will be back soon.
RandomForestClassifier
Another python code for the classifier.
from sklearn.ensemble import RandomForestClassifier
This is it for this section! The further steps of coding will come soon.
Results
OneHotEncoder
One of the useful features or attributes of the encoders is get_feature_names(). This will bring all of the variable names associated with the encoding. Let's take a look at the code and the output. Remember that ct from above is back.
ct.get_feature_names()
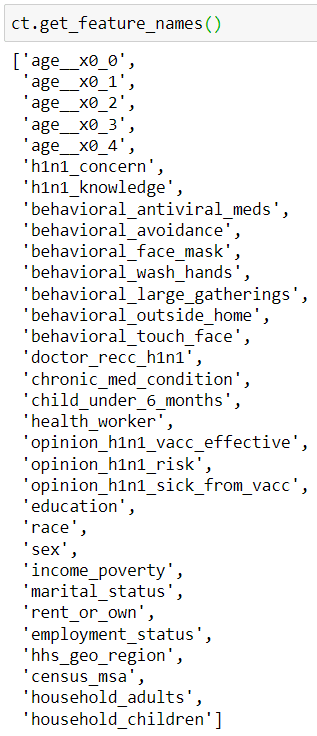
The age column is successfully encoded. What if we use the pipeline? Let's instantiate the pipeline first.
# import library
from imblearn.pipeline import Pipeline

# instantiate pipeline using column transformer and
# model from classifier
pipe2 = Pipeline(steps=[('ct', ct),
                        ('rfc', RandomForestClassifier(random_state=1,
                                                       max_depth = 9))
                       ]
                )
pipe2.fit(X_train_labeled, y_train)
Please pay attention to the pipeline model, pipe2 as it will be back several times in this post. Here is the magic code.
pipe2.steps[0][1].get_feature_names()
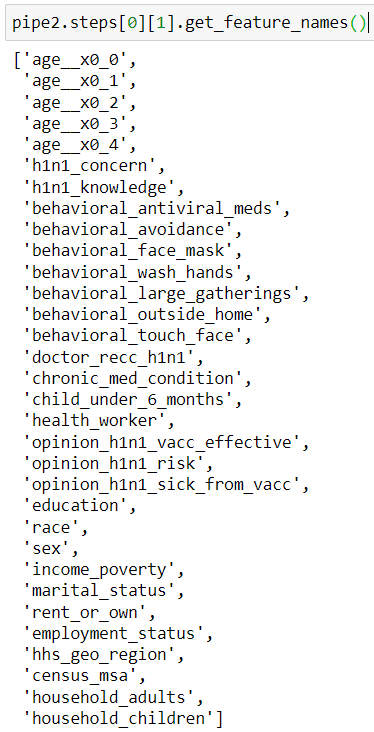
What just happened? A pipeline can show you what steps are taken, and it lets you use attributes of each step after it is called.

As you can see from the image above, pipeline steps are saved as a list of tuples. Each step can be called like the image shown below.
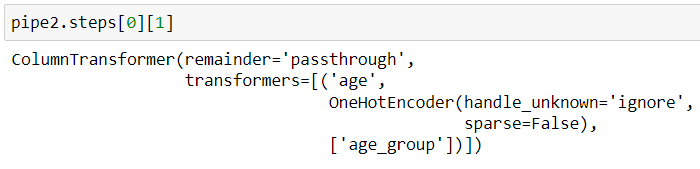
Then, you can use any available attributes to get the information you need.
RancomForestClassifier
Let me repeat with the classifier. Let's begin one without the pipeline.
rfc=RandomForestClassifier(random_state=1, max_depth = 9)
X_train_labeled_ct = ct.fit_transform(X_train_labeled)
rfc.fit(X_train_labeled_ct, y_train)
rfc.feature_importances_

Here is the one with the pipeline.
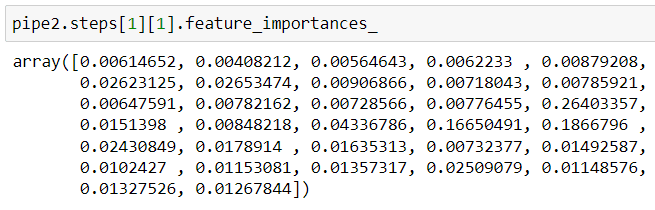
It can be seen that once a pipeline is declared, the coding gets simplified.
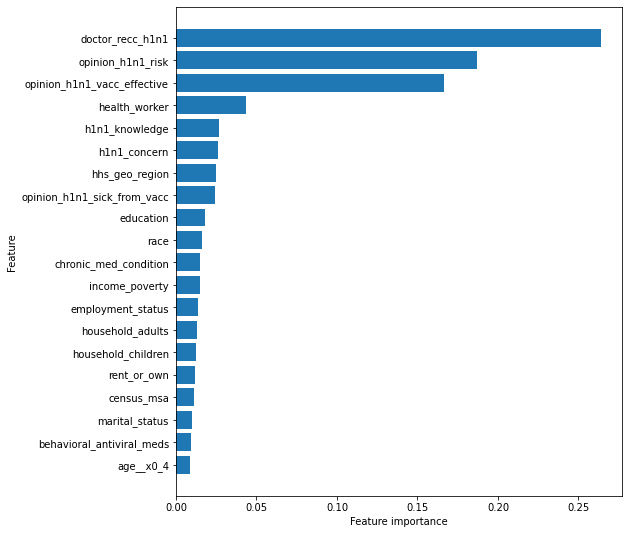
Application
Using the above results, we can do something like the below!
# graph of the features sorted by the impact level on the analysis
import pandas as pd
import numpy as np
import matplotlib.pyplot as plt
%matplotlib inline

# extract feature importance scores and feature names
# then merge them
feat_impt = pd.concat([pd.DataFrame(pipe2.steps[1][1].feature_importances_,
                                    columns = ['FI_score']),
                       pd.DataFrame(pipe2.steps[0][1].get_feature_names(),
                                    columns = ['Features'])],
                      axis = 1
                     )

# sort descending by importance
feat_impt.sort_values(by = 'FI_score', inplace=True)

# print graph of the top 20 important features
plt.figure(figsize=(8,9))
plt.barh(range(20), feat_impt.FI_score[-20:], align='center')
plt.yticks(np.arange(20), feat_impt.Features[-20:])
plt.xlabel('Feature importance')
plt.ylabel('Feature');

Top comments (0)