This article has been previously published on my main blog.
The other day I needed to complete a task for a client, this task consisted of creating an interactive map based on a static SVG. In this article, I'll explain how I accomplished the job 👌
Photo by Andrew Stutesman on Unsplash
First things first
The problem was that the map used wasn't interactive at all, to show the selected regions you needed to add CSS classes, and there could be only one selected region at one time.
So I searched the Internet for maybe one angular library that could fit my needs, but, unfortunately, without results 😢
Let's create a new Angular lib
So I said to myself: Why not create a new library yourself? and that was it, I opened up my terminal and I typed
ng new lib @daudr/interactive-italy
(Yes, I started this project with only Italy in mind, but interchangeable maps are coming, stay tuned! 😉)
Create the main component
So I started creating the main component of the library, interactive-italy.component.ts, but what's really is this component?
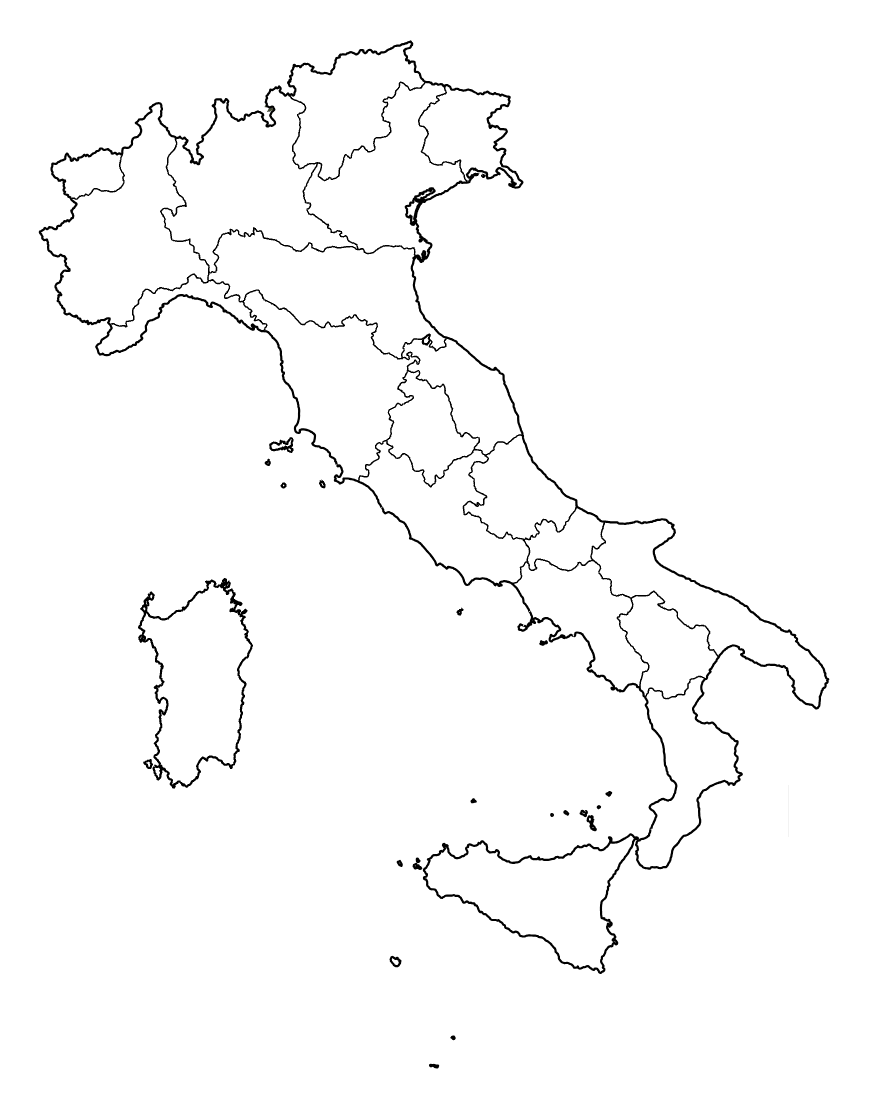
The answer is simpler than you think, firstly I had to find the right SVG image, and being a noob in all of that I decided to look upon the Internet and I found just what I needed:
Thanks Wikimedia ❤
The only problem was the map wasn't interactive.
<svg
  width="460.30981"
  height="562.58575"
>
  <path
  *ngFor="let region of regions"
  [attr.d]="region.d"
  [attr.title]="region.title"
  (click)="onRegionClick(region.title)"
  [ngClass]="{ selected: region.title | selected: selectedRegions }"
  />
</svg>
It's all here, just that.
Create the data
But let's find out what powers it:
The regions object represents an array that contains all the regions of the map as SVG's paths
export const REGIONS: Region[] = [
  {
    d:
      'm 374.27021,304.03051 1.36,6.34 2.24,5.51 6.27,11.18 7.01,7.71 8.24,6.15 0.87,2.33 3.67,3.53 0.33,1.35 5.56,3.7 5.16,1.83 0.21,4.85 3.43,2.43 0,0 -1.17,1.85 0.91,0.84 -2.84,1.96 -2.3,2.84 -0.82,3.1 -2.36,1.66 -1.72,3.73 -4.76,5.13 -2.04,-0.37 0.79,-0.64 -1.07,-4.29 -1.1,-1.07 -2.44,-1.62 -1.05,1.32 -0.57,-0.22 -0.98,-2.19 -1.24,0.13 -0.94,-1.26 -2.91,2.38 -1.43,2.22 -2.22,0.15 -0.42,0.9 1.25,3.55 1.52,0.89 -0.42,1.03 -0.85,-0.13 -0.25,-1.01 -0.67,1.24 -1.99,0.05 -0.63,2.64 -0.79,-2.07 -1.16,0.09 -0.87,2.4 -1.33,0.05 -0.28,1.46 -1.87,-0.98 -2.1,0.52 0,0 -2.49,-3.27 -1.96,0.19 -2.4,-1.41 -1.03,0.65 -1.33,-0.4 -1.75,-3.31 -1.32,0.73 -1.07,-1.18 -1.78,-0.49 -1.06,2.09 -4.05,1.35 -1.48,-0.93 -0.73,-1.81 -1.84,-0.43 -1.48,-1.43 -1.73,-0.7 -1.4,1.36 -1,-3.63 1.28,-2.29 -1,-1.41 -1.01,0.18 -1.98,-2.28 -0.9,0.37 -7.65,-4.49 -2.03,-0.72 -0.02,1.24 -2.38,-0.64 -1.41,-2.25 0.15,-4.92 0.78,0.36 2.08,-1.78 0.05,-2.39 1.73,-0.13 6.56,3.53 1.24,-0.77 1.69,0.62 1.07,-2.23 1.5,-0.29 -0.53,-0.71 1.83,-0.33 -1.93,-1.22 -0.3,-1.63 -2.43,-0.84 -2.58,-2.54 -0.65,-3.28 -3.74,-2.48 2.08,-2.33 -3.99,-3.74 3.18,-2.42 -0.1,-2.38 -1,-1.86 1.03,-0.58 0.76,-2.76 2.75,1.04 0.61,-0.73 1.35,0 0.58,0.98 1.5,-0.77 2.26,0.31 1.35,-1.17 0.76,-3.43 -1.99,-0.63 -1.15,-1.37 0.54,-1.68 0,0 0,0 0,0 0,0 0,0 1.66,0.48 1.88,-1.33 0.57,0.46 0.6,-2.37 2.37,-0.39 0.3,-2.49 1.34,-1.49 0.24,-1.44 2.08,1.13 2.37,-1.11 0.67,0.94 1.35,-0.17 2.01,-0.94 0.46,-2.21 0.68,-0.38 2.78,-0.18 2.11,-1.41 4.99,-1.07 0,0 z',
    title: 'Abruzzo'
  },
  {
    d:
      'm 457.43021,430.14051 -0.33,-1.23 1.34,-1.23 1.95,-0.38 4.65,0.78 2.51,-0.9 1.45,1.05 1.69,-0.91 -0.16,-0.95 1.67,-0.43 -0.18,-0.76 0.82,0.29 1.42,-0.85 2.3,1.65 1.74,0.3 0.24,1.03 1.26,0.3 0.61,2.35 0.62,-0.42 1.84,1.5 -0.64,1.04 0.3,1.55 -1.79,2.05 -1.51,-0.27 0.61,1.13 5.59,2.38 1.59,1.51 2.14,-1.96 2,0.65 2.94,6.46 6.56,6.05 0.78,1.74 1.53,0.42 3.48,-4.04 2.04,2.47 -0.06,-1.89 0.97,-0.26 0.85,1.33 0.11,-1.74 1.69,0.73 1.01,-0.64 0.17,0.99 1.17,0.7 0.54,-0.74 2.92,2.22 -1.03,0.51 1.22,1.41 -0.9,3.62 0.92,2.05 -0.63,0.46 -0.43,2.89 0.96,1.01 -0.44,0.81 1.16,0.88 -0.96,2.08 0.86,0.94 1.7,-0.43 1.77,1.07 0.37,1.62 1.74,1.47 0.78,1.86 0,0 -3.94,5.64 -4.81,10.36 -2.29,1.67 0,0 -2.72,-0.95 -3.12,0.97 -3.08,-1.02 -1.91,0.37 -0.66,-1.11 -0.63,1.47 0.22,2.84 -1.03,2.22 0.26,2 -3.05,5.44 1.11,1.14 -0.44,1.32 -2.14,-2.39 -2,-0.18 -2.93,0.66 -0.02,1.75 -2.78,-1.27 -1.04,1.08 -4.8,0.26 -1.55,-1.74 0.37,-0.62 -0.85,-1.6 1.24,-2.23 -1.16,-0.32 -1.49,0.85 -0.69,-0.96 -1.85,-0.3 -1.43,1.23 -0.62,-0.87 -0.93,0.49 -0.9,-0.94 -1.68,0.18 -2.35,2.53 -0.95,2.6 0,0 -1.79,-3.55 -2.1,-1.92 -0.14,-1.48 -1.68,-0.98 0,0 1.69,-1.01 -1.27,-1.38 1.21,-0.34 1.56,-2.12 -0.32,-2.91 1.62,-1.65 -0.14,-1 3.47,-1.48 -0.52,-1.23 0.93,-0.83 -0.04,-1.42 -0.61,-1.15 -2.93,-0.85 -0.14,-1.32 -1.64,-1.51 -0.05,-2.56 -2.1,-0.76 -1.6,-2.14 -2.06,-1.03 -0.48,-1.73 -2.17,-1.71 0.72,-1.08 -1.35,-3.21 0.7,-0.82 -4.35,-2.63 0.73,-2.02 1.65,-1.01 0.06,-0.81 -5.93,-3.85 0.17,-4.85 -0.82,-0.07 0.22,-1.18 -2.06,-1.27 2.1,-0.15 0.12,-2.14 -1.02,-0.52 0.43,-0.66 4.79,1.08 0.64,-0.35 -0.23,-1.16 2.96,-1.29 2.26,-5.87 z',
    title: 'Basilicata'
  },
  ...
]
And then comes the logic behind all
If we add some logic we have our full component
export class InteractiveItalyComponent {
  public regions = REGIONS;
  public selectedRegions: string[] = [];

  @Output() regionsChange = new EventEmitter<string[]>();

  onRegionClick(region: string) {
    const index = this.selectedRegions.indexOf(region);
    index === -1 ? this.selectedRegions.push(region) : this.selectedRegions.splice(index, 1);

    this.regionsChange.emit(this.selectedRegions);
  }
}
But don't forget the utilities
I just added a pipe know if a region has been selected:
export class SelectedPipe implements PipeTransform {
  transform(value: string, regions: string[]): boolean {
    return regions.indexOf(value) !== -1;
  }
}
And that's it! We built a fully interactive map of Italy just from an SVG image, isn't that cool? 😎
As a reminder I published this Angular library on NPM as Open Source, so check it out if you want!
@daudr/interactive-italy on NPM
Also, let me know if you'd like to read how to publish an Angular library on NPM


Top comments (0)