Question Title
How to deal with the issue of an uppermost area chart obscuring the lowermost scatter chart in a composite chart?
Question Description
I have created a composite chart using VChart, which includes two sub-graphs, both of type area chart. Because the second sub-graph is plotted on top of the first one, its area covers the data points of the first sub-graph, making it impossible for the data points of the first sub-graph to trigger hover and click events. I would like to ask if there is any way to solve this problem?
The chart configuration goes as follows:
`
const spec = {
"data": [...],
"series": [
{
"id": "area",
"type": "area",
"xField": "time",
"yField": "value",
"seriesField": "groupName",
...
},
{
"id": "compare",
"type": "area",
"name": "compare",
"xField": "time",
"yField": "compareValue",
"seriesField": "groupName",
...
"interactive": {
"line": false,
"area": false
}
}
]
}
const vchart = new VChart(spec, { dom: CONTAINER_ID });
vchart.renderAsync();
`

Solution
This issue can be addressed by setting the line.interactive and area.interactive attributes of the second area chart series to false. The configuration is as follows:
{

"data": [...],

"series": [

{

"id": "area",

"type": "area",

"xField": "time",

"yField": "value",

"seriesField": "groupName",

...

},

{

"id": "compare",

"type": "area",

"name": "compare",

"xField": "time",

"yField": "compareValue",

"seriesField": "groupName",

...

"line":{

"interactive":false

},

"area":{

"interactive":false

},

}

]

}
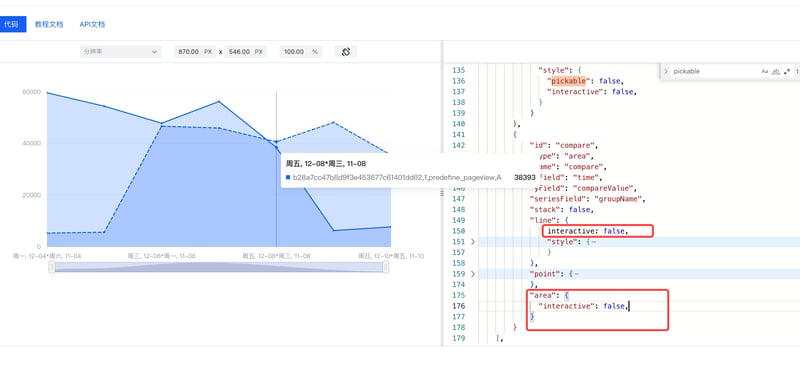
This way, the second area sub-chart will not respond to interactive events, and user hover and click events can trigger the data points of the first area sub-chart through the second area sub-chart.
Results
By using the above configuration and rendering the chart, you will find that the lines and areas of the second sub-chart will no longer respond to mouse operations, so the hover and click of the first sub-chart can be successfully triggered.
For online effects reference: https://codesandbox.io/s/common-chart-interactive-jtmc92?file=/src/index.ts
Related Documentation
Related api: https://www.visactor.io/vchart/api/API/vchart
Github: https://github.com/VisActor/VChart


Top comments (0)