While I spend my work days thinking about how to make the cloud easier to use and more powerful, I started out pursuing a degree in hardware engineering. I spent most of my time at university writing VHDL, trying to wrangle magnets and electric fields, and contorting my mind into understanding Physics. That said, since University my hardware skills have atrophied a great deal; all I have left to prove any of this are some books no one would buy otherwise. So please, no questions about RC circuits.
Even so, I still enjoy bridging the worlds. Lately that is usually via MicroPython or CircuitPython (depending on the hardware). It is approachable and a low-entry to solving whatever problem I may have at the time. I like to keep these boards out on my desk to taunt me: “Hey, have anything for us to do?”
My latest experiment was around temperatures. While where I live, Seattle, has generally stable temperatures, it does get cooler in winter. My basement is conditioned, but I keep the heat vents closed since it is mostly storage and a laundry room. I also have a modest wine collection and wine prefers cooler temperatures. But is it cool enough? Is it too cold? How much does the temperature vary? Can I figure this out with bits I have on hand?
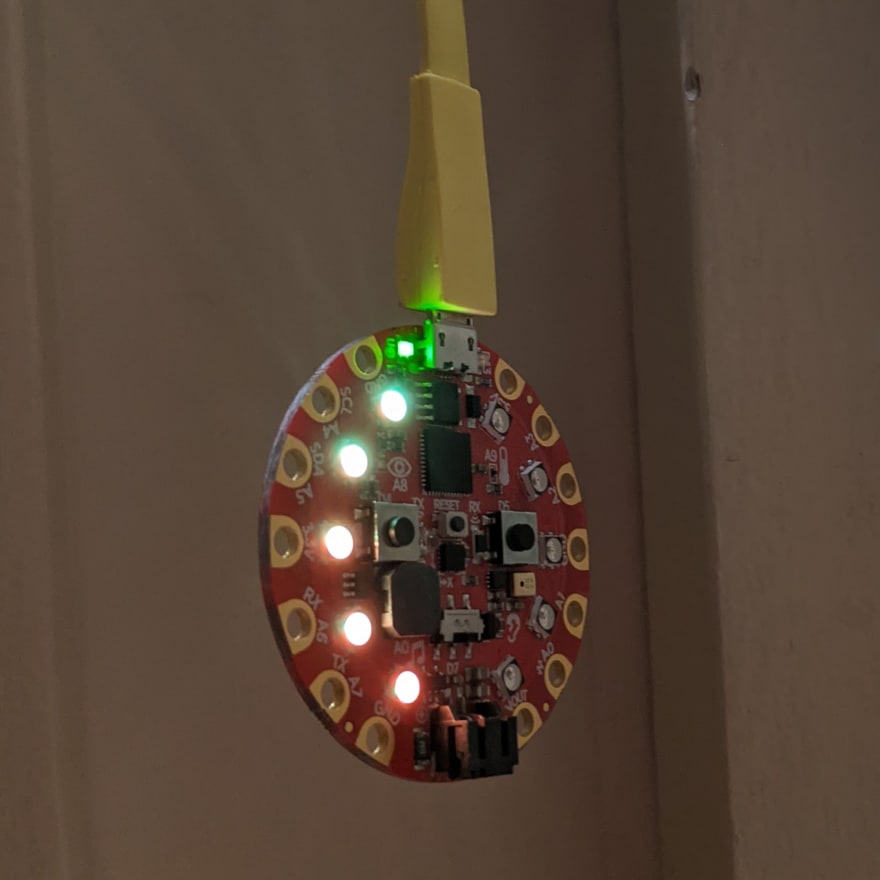
Out of the boards I have around, theCircuit Playground Expressseemed like a good option, as it has a temperature sensor included.
Circuit Playground Express makes it really easy to read a temperature sensor.
import time
from adafruit_circuitplayground.express import cpx
while True:
    temperature = cpx.temperature * 1.8 + 32
    print("Temperature F: {}".format(temperature))
    time.sleep(1)
That’s it really. On a continuous loop, cpx.temperature is read, converted from celsius (because America), and then printed to the console. If you are connected to a serial monitor you can view the results from there. If you aren’t familiar with this I’d recommend looking intoMu Code as the built in serial debug is easy to setup.
So, proof of concept is there, I can use the board to get room temperature data. Though there are a few further things I would like to accomplish for my particular use case.
- I am going to want to track temperature over a few days. So, once a second is way too often. Instead, I’ll get the updates every minute.
- It would be nice if the board communicated its state a bit. For instance if an error is encountered, or what temperature the sensor is reporting. So I want to configure the NeoPixel LEDs to display different patterns to indicate different states.
- I don’t want to have to leave the board plugged into a computer. I’d like to be able to leave it alone just powered, and collect the data later.
- While the temperature reported is reasonable, it is a bit higher than my thermostat. I expect the results will need to be adjusted a bit to reflect actual room temperature.
Reporting board status via LEDs
One of the difficulties of using a microcontroller can be the lack of a console or display. Though, because the Circuit Playground Express has 10 NeoPixels (and a status LED) there are ways to communicate small bits of information. For this project, it would be good to know if something has went wrong (an exception) and what the temperature being read is.
As this is used indoors, I don’t expect I would read a temperature under 50F or over 95F. Given that, for each 5F increment, an additional LED could be illuminated on the board.
def color_temperature(temp):
    # Use Neopixels to show temperature,
    # incrementally lighting up another NeoPixel
    # add a light for each extra 5 degrees
    # 50 (0), 55 (1), 60 (2), 65 (4), 70 (5),
    # 75 (6), 80 (7), 85 (8), 90 (9), 95 (10)

    # turn all off first
    cpx.pixels.fill((0,0,0))

    temp = int(temp) - 50
    leds_on = min(temp / 5, 10)
    print(leds_on)
    for i in range(leds_on):
        print(i)
        cpx.pixels[i] = color.HEAT_COLORS[i]
    cpx.pixels.show()
Configuring a Circuit Playground Express to allow storing data.
In order to use the device without a serial monitor, it needs to be able to store a small amount of data back to the device. There is a complete guide of how to use storage with Circuit Playground available onAdafruitbut at a high-level, the built-in toggle switch can be used to determine if writing is being done over USB (for development) or via the code in code.py(for data capturing).
A small bit of code should be written to boot.py to initialize the storage state before executing the code included in code.py
# Contents of boot.py
import board
import digitalio
import storage

switch = digitalio.DigitalInOut(board.D7)
switch.direction = digitalio.Direction.INPUT
switch.pull = digitalio.Pull.UP

# If the D7 is switched on (towards B button),
# CircuitPython can write to storage
storage.remount("/", switch.value)
Once boot.py is saved to the board, reset the Circuit Playground Express. Now code.py can write to storage if cpx.switch is set to False. Otherwise, there is a small bit of code to flash the LEDs to make it clear the program is not storing data.
# If Switch is to left, we aren't in write mode, flash yellow LEDs to warn
if cpx.switch:
    cpx.pixels.fill(color.YELLOW)
    cpx.pixels.show()
else:
    with open("/temperatures.txt", "a") as f:
        f.write("{}, {}\n".format(temperature, time_from_start))
Putting all of the pieces together, the resulting code.py file is as follows:
import time

from adafruit_circuitplayground.express import cpx

# Turn down LED brightness as 1 is *very* bright
cpx.pixels.brightness = 0.02

# Configure NeoPixel state to update on show()
cpx.pixels.auto_write = False

class color:
    RED = (255,0,0)
    YELLOW = (255,255,0)
    HEAT_COLORS = [
        (255, 255, 0),
        (255, 255, 0), # YELLOW
        (255, 150, 0),
        (255, 150, 0), # YELLOWORANGE)
        (255, 100, 0),
        (255, 100, 0), # ORANGE
        (255, 50, 0),
        (255, 50, 0), # REDORANGE
        (255, 0, 0),
        (255, 0, 0), # RED
    ]

def color_temperature(temp):
    # Use Neopixels to show temperature,
    # incrementally lighting up another NeoPixel
    # add a light for each extra 5 degrees
    # 50 (0), 55 (1), 60 (2), 65 (4), 70 (5),
    # 75 (6), 80 (7), 85 (8), 90 (9), 95 (10)

    # turn all off first
    cpx.pixels.fill((0,0,0))

    temp = int(temp) - 50
    leds_on = min(temp / 5, 10)
    print(leds_on)
    for i in range(leds_on):
        print(i)
        cpx.pixels[i] = color.HEAT_COLORS[i]
    cpx.pixels.show()

# time.monotonic() allows for non-blocking LED animations!
time_from_start = 0
start = time.monotonic()
while True:
    now = time.monotonic()

    # Display a red led when switch is to the left.
    cpx.red_led = cpx.switch

    temperature = cpx.temperature * 1.8 + 32
    print("Temperature F: {} t: {}".format(temperature, time_from_start))

    # If Switch is to left, we aren't in write mode, flash yellow LEDs to warn
    if cpx.switch:
        cpx.pixels.fill(color.YELLOW)
        cpx.pixels.show()

        color_temperature(temperature)

        # Blink yellow lights every second.
        time_from_start += 1
        time.sleep(1)
    else:
        try:
            with open("/temperatures.txt", "a") as f:
                f.write("{}, {}\n".format(temperature, time_from_start))
            color_temperature(temperature)
            cpx.pixels.show()
        except OSError as ex:
            print("Cannot write while connected to pc: {}".format(ex))
            cpx.pixels.fill(color.RED)
            cpx.pixels.show()

        # Wait 60 seconds before recording the next temperature update.
        time_from_start += 60
        time.sleep(60)
And the result of running the code above is a CSV of temperatures and time offsets:
74.5162, 0
73.3791, 60
72.8705, 120
72.4798, 180
72.3626, 240
Calibrating temperatures
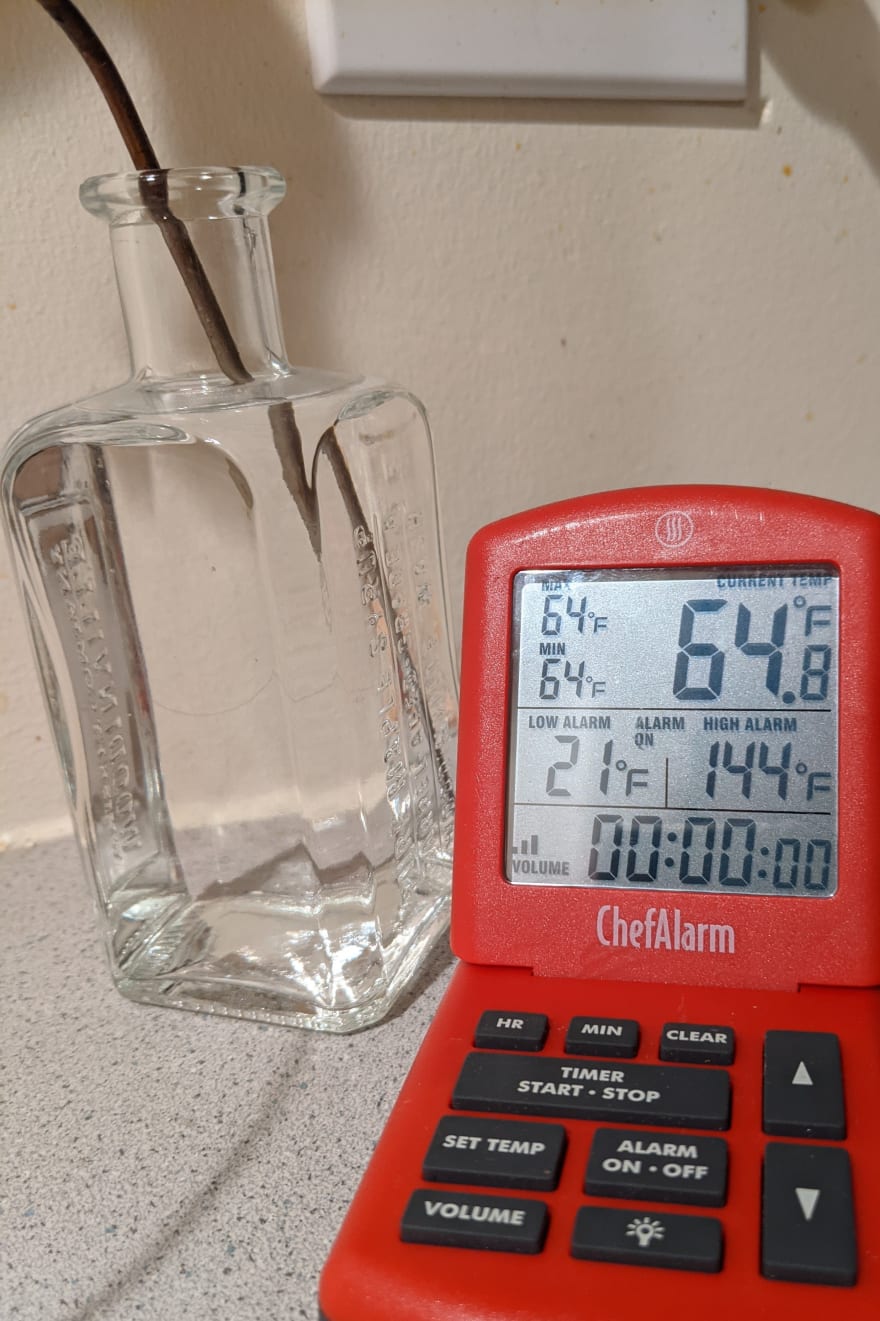
As stated earlier, the temperature sensor on the board is a bit adrift of the actual temperature. Fortunately I have a well-calibrated thermometer. While it isn’t guaranteed the deviation is linear, I am going to assume it is as the variation in temperature isn’t significant from preliminary looks at the data. I left a container of water in the space and measured it just before stopping data collection. At the time I captured this photo, the temperature sensor was reporting 71.97F and my calibrated thermometer showed 64.8F. The temperature on the board is about 7.2F off.
Looking at the data
Processing the collected data is straightforward enough, and can be done mostly with builtin Python libraries and matplotlib. As the data was stored as a CSV, I can use a CSV reader. There is a small amount of processing needed per row, shifting the temperature value after calibration and converting the time delta to a datetime, as that should be easier to reason about than seconds from start of collection.
from datetime import datetime, timedelta
import csv

import matplotlib.pyplot as plt
import datetime

start_time = datetime.datetime(2020, 11, 12, 17, 32)

times = []
temperatures = []

with open("temperatures.txt") as f:
    reader = csv.reader(f, delimiter=',')
    for temperature, time_offset in reader:
        # Reported temperature of 71.9724 recorded as 64.8F
        # Offset temperatures by 7.2F
        temperature_adjusted = float(temperature) - 7.2
        temperatures.append(float(temperature_adjusted))
        t = start_time + timedelta(seconds=int(time_offset))
        times.append(t)

plt.plot(times, temperatures)
plt.ylabel('Temperature')
plt.xlabel('Time')
plt.grid(True)

plt.savefig("temperatures.png")
Summary
So, what did I find out? While my basement is cooler than my main floor, it is a ways off from a wine cellar. No risk of things freezing though. :) I must admit, there are lower tech solutions to problems like this. I could have just left my thermometer in this room for a while, periodically checking in on it, but that wouldn’t have given me an opportunity to explore writing to storage with CircuitPython and Circuit Playground Express. And sometimes, that is what is fun about microcontrollers like this. It’s why I leave them out on my desk; to tempt me into doing silly things.
Originally published at https://chriswilcox.dev on 17 November 2020


Top comments (0)