Research on speed and performance of 1265 Gatsby built websites.
I’m sure you must be wondering what’s behind a catchy title like this, right? Quite recently I’ve analyzed 20k web dev, SEO, and marketing agency websites for speed and performance results, and what I learned is not that good...which is a different story altogether than the one I wanted to share here.
Now, only 0.27% of websites in that research were built with Gatsby. And with Gatsby being one of the most favorite static site generators in the Jamstack communities I wondered how fast are Gatsby sites? On average of course. So, I needed more URLs.
The more data you have the better the quality of results (and conclusions) is. On the other hand, this type of work goes well beyond my work duties.
I guess what I’m saying is that I had far less time and resources for this time. This also means I had to opt-out for BuiltWith data of websites across different verticals rather than web dev, SEO, and marketing agency websites only. And in a much smaller number.
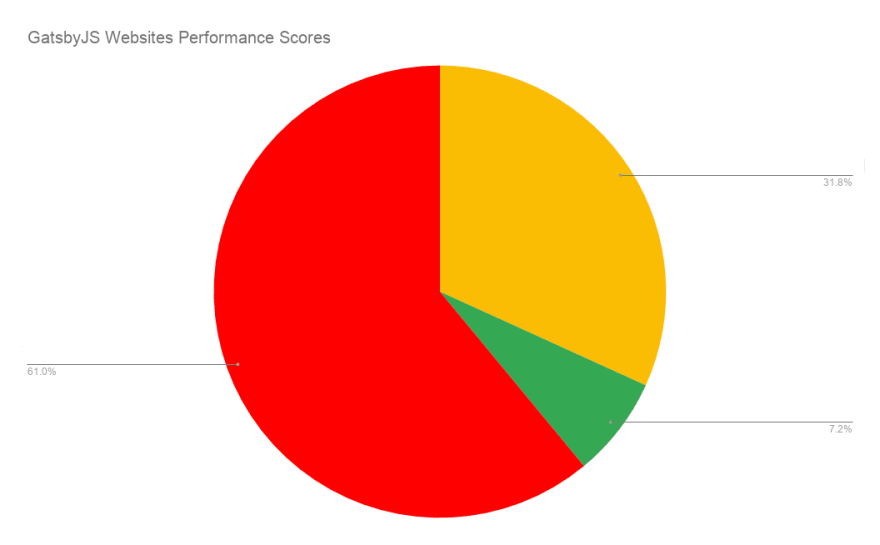
But the results are interesting. Take a look:

Google color-coded perf scores according to these ranges:
0 to 49 (Red): Poor
50 to 89 (Orange): Needs Improvement
90 to 100 (Green): Good
You can read more about it here.
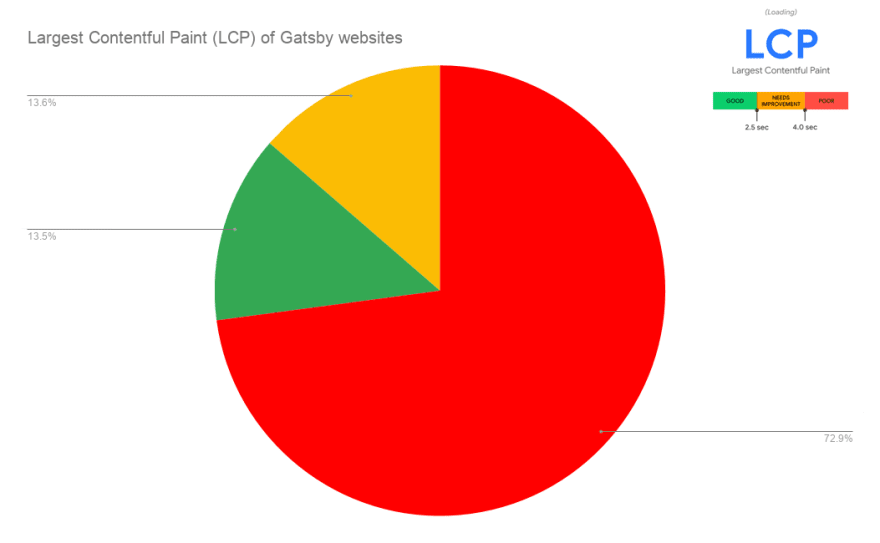
While waiting on core web vitals to kick in le’s look at the Largest Contentful Paint (LCP) results:

Instead of conclusion
In some ways comparing these results and the results of my previous research is like comparing apples and oranges. And the URL sample is small. But I do like what I see😋
I mean 7.2% of Gatsby sites with good pref scores vs 2.7% and 31.8% vs 20.2% with needs improvement scores sounds like we’re on the right path for both us as devs and audience the website we’re working on.
Let me know what you think in the comments. Thx.


Top comments (0)