
Some years after the release of bitcoin, many different crypto-currencies have been created.
Bitcoin is currently worth $10,247. Other coins have lower prices, but don't have the same market cap.
Many coins have been based on the Ethereum blockchain. Ethereum allows you to create coins on top of their chain. This I think, is part of the reason why Ethereum is the 2nd most popular coin.
Ethereum is different from bitcoin in the sense that every node runs a virtual machine, called the Ethereum virtual machine. This enables you to creates "smart contracts" (programs).
So after 2008 many alt coins had a bust trend. Will this continue, or did the fear cycle end and will we see an uptrend now? Did the general public look on to short time frame?
Alt coins
Lets use Python to analyze the yearly trend of these crypto coins.
Yes, with Python we can analyze the trend.
The code grabs the data from the market place API, it returns JSON data. The JSON data is then parsed and the price extracted. That is then used to create the plots with matplotlib.
#!/usr/bin/python3
import time
import os
import json
import requests
from bs4 import BeautifulSoup
import csv
import sys
from time import sleep
from time import gmtime, strftime
import matplotlib.pyplot as plt
enddate = strftime("%Y%m%d", gmtime())
r = requests.get("https://coinmarketcap.com/currencies/monero/historical-data/?start=20140101&end={0}".format(enddate))
data = r.text
soup = BeautifulSoup(data, "html.parser")
table = soup.find('table', attrs={ "class" : "table"})
prices = []
for row in table.find_all('tr'):
addPrice = False
tag = row.findAll('td')
for val in tag:
value = val.text
if "Sep 10" in value:
print(value)
addPrice = True
if addPrice == True:
prices.append( tag[3].text )
# flip list, months are in reverse order
prices = prices[::-1]
for i in range(0,len(prices)):
prices[i] = float(prices[i])
#for price in prices:
# price = float(price)
print(prices)
x = list(range(0, len(prices)))
print(x)
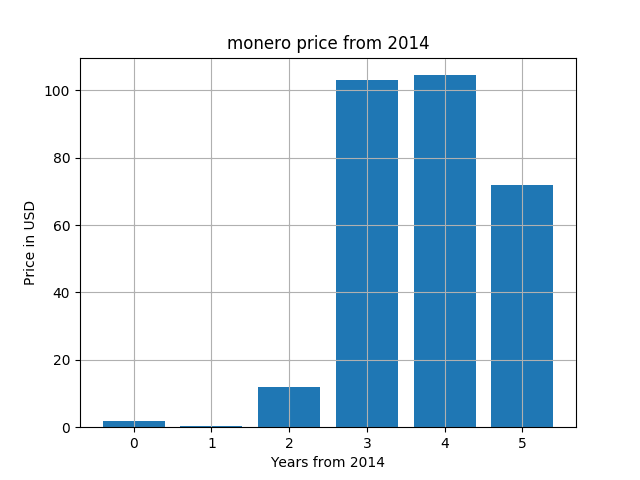
plt.title('monero price from 2014')
plt.ylabel('Price in USD')
plt.xlabel('Years from 2014')
plt.bar(x,prices)
os.system("rm -rf chart.png")
time.sleep(1)
#plt.savefig('chart.png')
plt.show()
Some popular alt coins:
Monero:
eos:

ethereum:
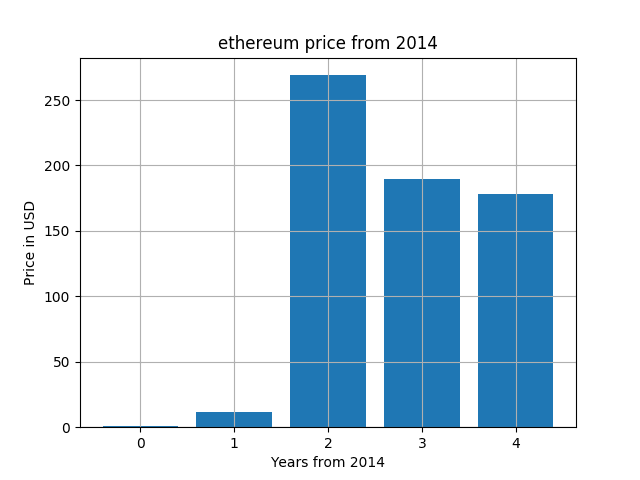
There has been an uptrend but now again a downtrend. The uptrend swing has been much larger than the downtrend swing. It may happen again. This is not financial advice.

Top comments (3)
Nice article. Thanks for sharing this. I have written a article on how to use coinmarketcap api. It is targeted for people new to APIs. Hope some of your readers will find it useful.
Something fun you can try is a stacked bar graph. It would be a way for you to combine the three graphs together while still being visually easy to read.
Thanks, I just wrote the code for that