
Overview
In my first post we went through how to deploy a Multi-Region CockroachDB cluster on Docker, locally.
We can expand that setup to include tools for Monitoring & Alerting, and also, to simulate having access to S3.
So go ahead and create the CockroachDB cluster so we can get started!
Setup S3 access using MinIO or S3Mock
Once you have your 9 nodes cluster up and running, we're ready to add the first service: S3. Here are the instructions for 2 such S3 compatible services, MinIO and S3Mock.
Setup one of the two.
Adobe S3Mock
Adobe S3Mock is a very simple S3 compatible service meant for some light testing.
Start S3Mock
# start s3mock with bucket 'cockroach'
docker run --name s3mock --rm -d \
  -p 19090:9090 \
  -p 19191:9191 \
  -v s3mock-data:/s3mock \
  -e initialBuckets=cockroach \
  -e root=/s3mock \
  adobe/s3mock

# attach s3mock to networks
docker network connect us-west2-net s3mock
docker network connect us-east4-net s3mock
docker network connect eu-west2-net s3mock
You can use this container for your backups, for example. This is how you do a full cluster backup, notice the endpoint URL
BACKUP TO 's3://cockroach/backups?AWS_ENDPOINT=http://s3mock:9090&AWS_ACCESS_KEY_ID=id&AWS_SECRET_ACCESS_KEY=key'
  AS OF SYSTEM TIME '-10s';
If you want to upload something from your host to the S3Mock container/server, make sure you have the awscli package installed
$ aws s3 cp myfile.txt s3://cockroach/ --endpoint-url "http://localhost:19090" --no-sign-request
upload: ./myfile.txt to s3://cockroach/myfile.txt
If the container crashes, or you stop it, don't worry: data is stored in the Docker Volume s3mock-data.
Minio
MinIO is a S3 compatible object storage service and it is very popular among private cloud deployments.
Start MinIO, then head to the MinIO UI at http://localhost:9000. The default Access Key and Secret Key is minioadmin.
# start minio with name 'minio'
docker run --name minio --rm -d \
  -p 9000:9000 \
  -v minio-data:/data \
  minio/minio server /data

# connect minio to network bridges
docker network connect us-west2-net minio
docker network connect us-east4-net minio
docker network connect eu-west2-net minio
From the UI, create bucket cockroach, then execute a backup job pointing at the MinIO server. Notice the endpoint URL and the keys used
BACKUP TO 's3://cockroach/backups?AWS_ENDPOINT=http://minio:9000&AWS_ACCESS_KEY_ID=minioadmin&AWS_SECRET_ACCESS_KEY=minioadmin'
  AS OF SYSTEM TIME '-10s';
Very good, the backup files are safely stored in MinIO!

If you want to upload a file from your host to MinIO, you need to provide the credentials
# export the credentials
$ export AWS_ACCESS_KEY_ID=minioadmin
$ export AWS_SECRET_ACCESS_KEY=minioadmin

$ aws s3 cp myfile.txt s3://cockroach/ --endpoint-url "http://localhost:9000"
upload: ./myfile.txt to s3://cockroach/myfile.txt
Again, data is safely saved in a Docker Volume, minio-data.
Setup Monitoring and Alerting
Our Monitoring and Alerting stack is made up of 3 components: Prometheus, Alertmanager and Grafana.
Prometheus
Prometheus is an open-source systems monitoring and alerting toolkit. You can use Prometheus to grab the metrics that populate Cockroach AdminUI for your own, separate monitoring and alerting system setup.
Prometheus requires a config file to start, so that it knows:
- what hosts to monitor
- what metrics to collect
- what to alert for
- whom to alert
Read through the YAML file to get an understanding of its configuration. Read more about the config file in the official docs.
Save below locally as file prometheus.yml.
---
global:
  scrape_interval: 10s
  evaluation_interval: 10s

rule_files:
  # what to alert for
  - /etc/prometheus/alerts.rules.yml
  # what metrics to collect
  - /etc/prometheus/aggregation.rules.yml

# whom to alert
alerting:
  alertmanagers:
    - static_configs:
        - targets:
            - alertmgr:9093

scrape_configs:
  - job_name: "cockroachdb"
    metrics_path: "/_status/vars"
    scheme: "http"
    tls_config:
      insecure_skip_verify: true
    static_configs:
      # what hosts to monitor
      - targets:
          - roach-seattle-1:8080
          - roach-seattle-2:8080
          - roach-seattle-3:8080
          - roach-newyork-1:8080
          - roach-newyork-2:8080
          - roach-newyork-3:8080
          - roach-london-1:8080
          - roach-london-2:8080
          - roach-london-3:8080
        labels:
          cluster: "crdb"
We also require 2 files with the definition of:
- the metrics
- the alerts
We use the files already prepared by Cockroach Labs.
# download the 2 files
wget https://raw.githubusercontent.com/cockroachdb/cockroach/master/monitoring/rules/alerts.rules.yml
wget https://raw.githubusercontent.com/cockroachdb/cockroach/master/monitoring/rules/aggregation.rules.yml

# update alert 'InstanceDead' to report dead node after 1 minute, not 15
# on OSX I am using gnu-sed: brew install gnu-sed; alias sed=gsed
sed -i 's/15m/1m/g' alerts.rules.yml
With these 3 files in your current directory, start the container.
# start prometheus with name 'prom'
docker run --name prom --rm -d \
  -v `pwd`/prometheus.yml:/etc/prometheus/prometheus.yml \
  -v `pwd`/aggregation.rules.yml:/etc/prometheus/aggregation.rules.yml \
  -v `pwd`/alerts.rules.yml:/etc/prometheus/alerts.rules.yml \
  -p 9090:9090 \
  prom/prometheus

# connect prom to network bridges
docker network connect us-west2-net prom
docker network connect us-east4-net prom
docker network connect eu-west2-net prom
In your browser, head to Prometheus UI at http://localhost:9090, pull any metric to confirm the service is up
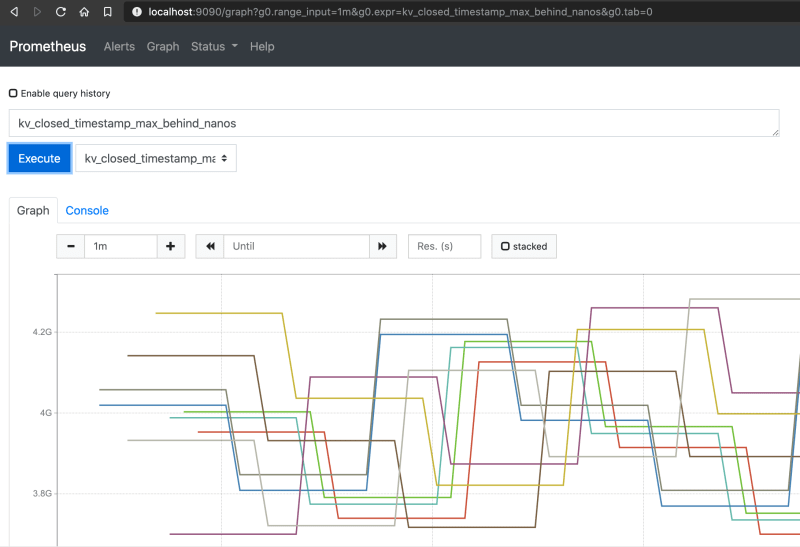
Very good, the service is up and correctly pulling metrics from our cluster! Head over to the Alerts section and confirm alert InstanceDead will fire after 1m
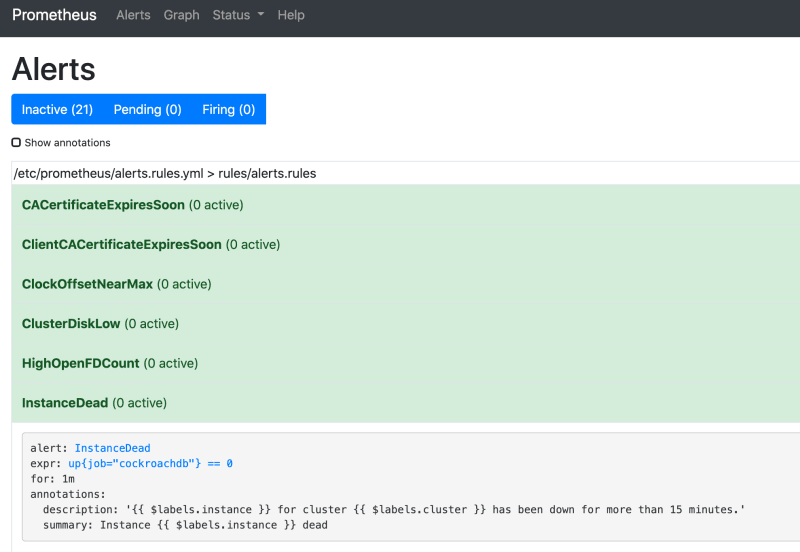
Good job, alerts are ready to fire!
Alertmanager
Alertmanager is also a product of the Prometheus project, check details in here.
In config file prometheus.yml we configured in the alerting section to send alerts to host alertmgr:9093.
Start Alertmanager with the default config file - we are not concerned with configuring AlertManager to send emails or Slack messages at this point.
# start alertmanger with name 'alertmgr'
docker run --name alertmgr --rm -d -p:9093:9093 quay.io/prometheus/alertmanager:latest

# connect alertmgr to network bridge
docker network connect us-east4-net alertmgr
Open the AlertManager UI at http://localhost:9093
To see an alert firing out to AlertManager, stop temporarely a node. Do so only for ~1 minute, then bring it up again
docker stop roach-london-3 && sleep 70 && docker start roach-london-3
While this is running, check that Prometheus fires the InstanceDead alert and that Alertmanger receives it.

Very good, Prometheus fired the alert and was actively broadcasted by AlertManager!
Grafana
The last piece of our stack is Grafana, a very popular visualization tool. We prefer using Grafana's dashboard instead of Prometheus, but you could use Prometheus or the CockroachDB Admin UI charts if you so wish.
Let's download Cockroach Labs pre-made Grafana dashboards
wget https://raw.githubusercontent.com/cockroachdb/cockroach/master/monitoring/grafana-dashboards/changefeeds.json
wget https://raw.githubusercontent.com/cockroachdb/cockroach/master/monitoring/grafana-dashboards/distributed.json
wget https://raw.githubusercontent.com/cockroachdb/cockroach/master/monitoring/grafana-dashboards/hardware.json
wget https://raw.githubusercontent.com/cockroachdb/cockroach/master/monitoring/grafana-dashboards/overview.json
wget https://raw.githubusercontent.com/cockroachdb/cockroach/master/monitoring/grafana-dashboards/queues.json
wget https://raw.githubusercontent.com/cockroachdb/cockroach/master/monitoring/grafana-dashboards/replication.json
wget https://raw.githubusercontent.com/cockroachdb/cockroach/master/monitoring/grafana-dashboards/runtime.json
wget https://raw.githubusercontent.com/cockroachdb/cockroach/master/monitoring/grafana-dashboards/slow_request.json
wget https://raw.githubusercontent.com/cockroachdb/cockroach/master/monitoring/grafana-dashboards/sql.json
wget https://raw.githubusercontent.com/cockroachdb/cockroach/master/monitoring/grafana-dashboards/storage.json
Now we can start Grafana
# start grafana
docker run --name grafana --rm -d \
  -v grafana-data:/var/lib/grafana \
  -p 3000:3000 \
  grafana/grafana

# connect grafana to network bridge
docker network connect us-east4-net grafana
Open the Grafana UI at http://localhost:3000 - you will need to create a login - then perform these 2 steps:
-
Go to Configuration > Data Sources > Add Data Source and choose "Prometheus". The prometheus server is at http://prom:9090

Click Save and Test
-
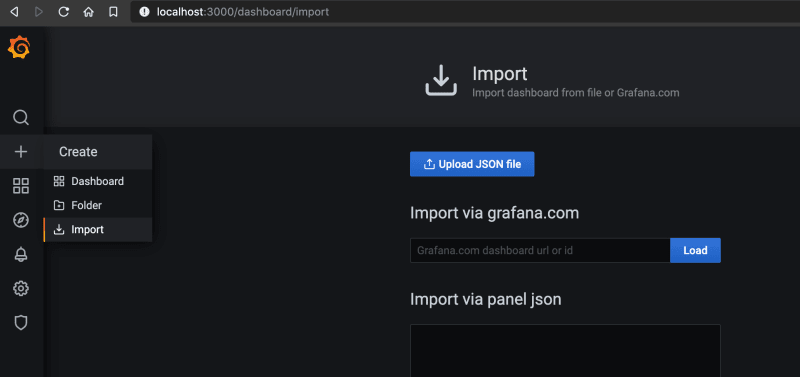
Go to + > Import and import all dashboard json files previously downloaded.
You're all set! Run your workload and see the charts update on the Dashboards

We have saved all our dashboards and our settings into Docker Volume grafana-data, so you don't have to re-import every time you restert the container.
Clean up
Stop the CockroachDB cluster as instructed in the blog post.
Stop the containers, they will self-destruct once stopped
docker stop s3mock minio prom alertmgr grafana
Remove the volumes
docker volume rm s3mock-data minio-data grafana-data

Top comments (0)