Are you currently running a large monolith in production? With every day
that passes, it becomes clearer the monolith needs to shrink.
Everybody on the team agrees, yet there's some unease. Splitting up a
monolith is a complex task, with challenges during the development phase
but also for operations.
The engineering tasks might be well defined, so you know "where to cut
out pieces", knowing what functionality needs to get extracted.
Everybody feels confident about that part of the process, though
bringing it into production comes with unknown unknowns. For instance,
we don’t know anything about its resource consumption.
For the monolith, you can rely on lots of historical data and
institutional knowledge.
In this post, we will explore how you can minimize the unknown
unknowns, so you and the team feel more confident deploying new
microservices into production.
What is Normal?
Without any data at hand, running a brand-new service in production can
feel uncomfortable. Usually, gathering data and experience takes weeks
or months, and is usually acquired by trial and error. In this blog
post, we want to get comfortable with the new service and find out about
its resource utilization. To help answer our questions, we're using a
Service Mesh: Calisti.
Calisti supports you in building up a better understanding of your
code's production behavior.
Getting Started
Let's start by creating a new Calisti account at
Calisti.app. Calisti offers a free tier that
allows you to work with two clusters for free. We assume you already
have a Kubernetes Cluster up and running you can install Calisti into.
Follow the install instructions here
to install Calisti into your cluster.
Once you're up and running, it's time to explore the user interface. For
demonstration purposes, we'll be using the httpbin
application to perform
our tests. Please go ahead save the following YAML snippet:
    # microservice.yml
    apiVersion: apps/v1
    kind: Deployment
    metadata:
      name: ms-deployment
      labels:
        app: httpbin

    spec:
      replicas: 1
      selector:
        matchLabels:
          app: httpbin

      template:
        metadata:
          labels:
            app: httpbin

        spec:
          containers:
            - name: httpbin
              image: kong/httpbin:latest
              ports:
                - containerPort: 80
    ---
    apiVersion: v1
    kind: Service
    metadata:
      name: httpbin-service
    spec:
      selector:
        app: httpbin
      ports:
        - protocol: TCP
          port: 80
Once you've saved the YAML code to a file, let's apply it to the
cluster:
$ kubectl apply -f microservice.yml
I installed the application into the default namespace. httpbin will
pose as our new microservice under test.
Determine reasonable Resource limits
While reading the YAML snippet above, you might have noticed the
container does not have any resource limits defined now. For a safe
production deployment, you always should configure resource requests and
limits. Otherwise, the service could starve other applications if it
is allowed to request unlimited amounts of CPU time and memory.
But how can we specify sensible defaults? If the resource limit is too
high, we might take away resources we could use for other pods instead.
Choosing a limit that's too low can cause delays in the best case, or
worse, crashes.
Therefore, we want to find out:
- A sensible default for resource requests
- A good default for resource limits.
Using a Service Mesh to learn about Resource Consumption
We can use Calisti to gather data to answer both questions. Let's start
with resource requests. Visit
http://127.0.0.1:50500/workloads?namespace=default. The workloads view
shows us all workloads, divided by namespace.. The workloads view shows
us all workloads, divided by namespace.
Select ms-deployment and click on Memory Saturation.

We use data in this screen to understand how much memory our application
uses while idling:

/>
In this case, this workload got rescheduled and uses a bit over 200MB
without handling any requests.
Let's see what happens once the service receives requests.
Open the Topology
window.

The application hasn't received any requests yet. Therefore, you will
see a notice, accompanied by a button to generate load. Click the button
to open the Generate HTTP Load dialogue. If you already see a
network topology diagram, you can find the dialogue behind a small
HTTP button to the left of the diagram.

- Namespace: default
- Service: httpbin-service
- Port: 80
- Method: POST
- Path: /bytes/423dsf
- Frequency: 100
- Duration: 30
(Path: This path accepts any kind of seed. Check out
http://httpbin.org/#/Dynamic_data/get_bytes__n_))
Once finished, click Submit. The load generator now runs in the
background. In the meantime, we want to understand better how our
service behaves. Once it experiences load, we'll see the service show up
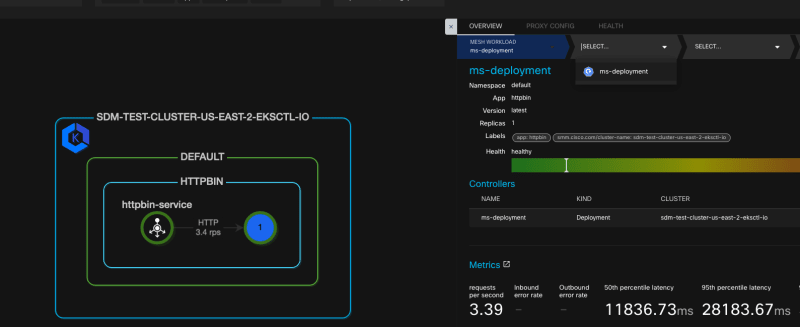
on the diagram. In the box that says "HTTPBIN", select the circle with
the 1.

On the right side, a new menu opens, providing us with access to
different stats and metrics. In the breadcrumb menu, click on the second
to the left entry and select the deployment from the list.
Scroll down, so that CPU Usage and Memory Usage diagrams come
into view. Here, we want to understand CPU Usage while the service
experiences an increase in requests. Additionally, we want to confirm
CPU utilization also drops once the surge of traffic ebbs off. The same
is true for memory usage. We can expect higher memory consumption, but
it should decrease eventually, once all requests are finished.
We can use data from these graphs to help us make an informed decision
on resource limits and requests. For instance, for our service, me might
end up with a configuration such as:
    apiVersion: apps/v1
    kind: Deployment
    metadata:
      name: ms-deployment
      labels:
        app: httpbin

    spec:
      replicas: 1
      selector:
        matchLabels:
          app: httpbin

      template:
        metadata:
          labels:
            app: httpbin

        spec:
          containers:
            - name: httpbin
              image: kong/httpbin:latest
              ports:
                - containerPort: 80
              resources:
                requests:
                  memory: "100M"
                  cpu: "250m"
                limits:
                  memory: "300M"
                  cpu: "500m"
    ---
    apiVersion: v1
    kind: Service
    metadata:
      name: httpbin-service
    spec:
      selector:
        app: httpbin
      ports:
        - protocol: TCP
          port: 80
We configure the requests.cpu to start with 0.25 CPU and limit it to 0.5
CPU (resources.limits.cpu). We follow a similar approach for memory,
starting with 100MB and limit its maximum at 300MB.
Conclusion
We're using Calisti to better understand how our code runs in production
and how it behaves under load. Especially, when we're deploying
brand-new code for which we lack historical performance data, Calisti
can help a great deal to minimize the feeling of uncertainty and go into
the first production deployment with more confidence.
Visit Calisti's Website today and create a free
account!

Top comments (0)