
In my previous article, I talked about the “why” and “how” of horizontal scaling in Kubernetes and I gave an insight, how to use the Horizontal Pod Autoscalar based on CPU metrics. As mentioned there, CPU is not always the best choice when it comes to deciding whether the application/service should scale in or out. Therefore Kubernetes (with the concept of the Metrics Registry and the Custom or External Metrics API) offers the possibility to also scale based on your own, custom metrics.
Introduction
In this post, I will show you how to scale a deployment (NodeJS / Express app) based on a custom metric which is collected by Prometheus. I chose Prometheus, as it is one of the most popular montoring tools in the Kubernetes space…but, it can easily be exchanged by any other montoring solution out there – as long as there is a corresponding “adapter” (custom metrics API) for it. But more on that later.
How does it work?
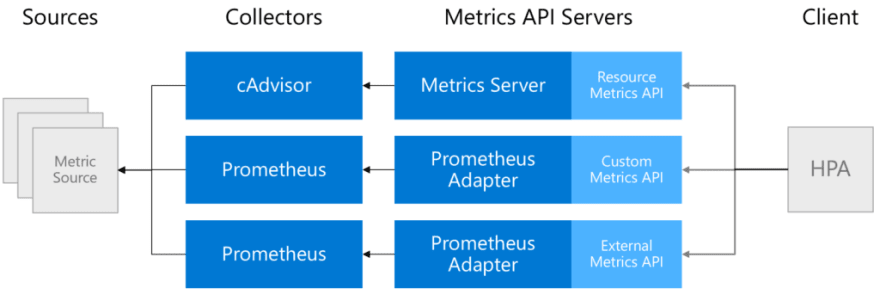
To be able to work at all with custom metrics as a basis for scaling services, various requirements must be met. Of course, you need an application that provides the appropriate metrics (the metrics source). In addition, you need a service – in our case Prometheus – that is able to query the metrics from the application at certain intervals (the metrics collector). Once you have set up these things, you have fulfilled the basic requirements from the application’s point of view. These components are probably already present in every larger solution.
Now, to make the desired metric available to the Horizontal Pod Autoscaler, it must first be added to a Metrics Registry. And last but not least, a custom metrics API must provide access to the desired metric for the Horizontal Pod Autoscaler.
To give you the complete view of what’s possible…here’s the list of available metric types:
- Resource metrics (predefined metrics like CPU)
- Custom metrics (associated with a Kubernetes object)
- External metrics (coming from external sources like e.g. RabbitMQ, Azure Service Bus etc.)
Sample
In order to show you a working sample of how to use a custom metric for scaling, we need have a few things in place/installed:
- An application (deployment) that exposes a custom metric
- Prometheus (incl. Grafana to have some nice charts) and a Prometheus Service Monitor to scrape the metrics endpoint of the application
- Prometheus Adapter which is able to provide a Prometheus metric for the custom metrics API
- Horizontal Pod Autoscaler definition that references the custom metric
Prometheus
To install Prometheus, I chose “kube-prometheus” (https://github.com/coreos/kube-prometheus) which installs Prometheus as well as Grafana (and Alertmanager etc.) and is super easy to use! So first, clone the project to your local machine and deploy it to your cluster:
# from within the cloned repo...

$ kubectl apply -f manifests/setup
$ kubectl apply -f manifests/
Wait a few seconds until everything is installed and then check access to the Prometheus Web UI and Grafana (by port-forwarding the services to your local machine):
$ kubectl --namespace monitoring port-forward svc/prometheus-k8s 9090
Forwarding from 127.0.0.1:9090 -> 9090
Forwarding from [::1]:9090 -> 9090

Check the same for Grafana (if you are promted for a username and password, default is: “admin”/”admin” – you need to change that on the first login):
$ kubectl --namespace monitoring port-forward svc/grafana 3000
Forwarding from 127.0.0.1:3000 -> 3000
Forwarding from [::1]:3000 -> 3000

In terms of “monitoring infrastructure”, we are good to go. Let’s add the sample application that exposes the custom metric.
Metrics Source / Sample Application
To demonstrate how to work with custom metrics, I wrote a very simple NodeJS application that provides a single endpoint (from the application perspective). If requests are sent to this endpoint, a counter (Prometheus Gauge – later more on other options) is set with a value provided from the body of the request. The application itself uses the Express framework and an additional library that allows to “interact” with Prometheus (prom-client) – to provide metrics via a /metrics endpoint.
This is how it looks like:
const express = require("express");
const os = require("os");
const app = express();
const apiMetrics = require("prometheus-api-metrics");
app.use(apiMetrics());
app.use(express.json());

const client = require("prom-client");

// Create Prometheus Gauge metric
const gauge = new client.Gauge({
  name: "custom_metric_counter_total_by_pod",
  help: "Custom metric: Count per Pod",
  labelNames: ["pod"],
});

app.post("/api/count", (req, res) => {
  // Set metric to count value...and label to "pod name" (hostname)
  gauge.set({ pod: os.hostname }, req.body.count);
  res.status(200).send("Counter at: " + req.body.count);
});

app.listen(4000, () => {
  console.log("Server is running on port 4000");
  // initialize gauge
  gauge.set({ pod: os.hostname }, 1);
});
As you can see in the sourcecode, a “Gauge” metric is created – which is one of the types, Prometheus supports. Here’s a list of what metrics are offered (description from the official documentation):
- Counter – a cumulative metric that represents a single monotonically increasing counter whose value can only increase or be reset to zero on restart
- Gauge – a gauge is a metric that represents a single numerical value that can arbitrarily go up and down
- Histogram – a histogram samples observations (usually things like request durations or response sizes) and counts them in configurable buckets. It also provides a sum of all observed values.
- Summary – Similar to a histogram, a summary samples observations (usually things like request durations and response sizes). While it also provides a total count of observations and a sum of all observed values, it calculates configurable quantiles over a sliding time window.
To learn more about the metrics types and when to use what, see the official Prometheus documentation.
Let’s deploy the application (plus a service for it) with the following YAML manifest:
apiVersion: apps/v1
kind: Deployment
metadata:
  name: promdemo
  labels:
    application: promtest
    service: api
spec:
  replicas: 1
  strategy:
    type: RollingUpdate
    rollingUpdate:
      maxSurge: 1
      maxUnavailable: 1
  minReadySeconds: 5
  revisionHistoryLimit: 3
  selector:
    matchLabels:
      application: promtest
      service: api
  template:
    metadata:
      labels:
        application: promtest
        service: api
    spec:
      automountServiceAccountToken: false
      containers:
        - name: application
          resources:
            requests:
              memory: "64Mi"
              cpu: "100m"
            limits:
              memory: "256Mi"
              cpu: "500m"
          image: csaocpger/expressmonitoring:4.3
          imagePullPolicy: IfNotPresent
          ports:
          - containerPort: 4000
---
apiVersion: v1
kind: Service
metadata:
  name: promdemo
  labels:
    application: promtest
spec:
  ports:
  - name: http
    port: 4000
    targetPort: 4000
  selector:
    application: promtest
    service: api
  type: LoadBalancer
Now that we have Prometheus installed and an application that exposes a custom metric, we also need to tell Prometheus to scrape the /metrics endpoint (BTW, this endpoint is automatically created by one of the libraries used in the app). Therefore, we need to create a ServiceMonitor which is a custom resource definition from Prometheus, pointing “a source of metrics”.
This is how the ServiceMonitor looks like for the current sample:
kind: ServiceMonitor
apiVersion: monitoring.coreos.com/v1
metadata:
  name: promtest
  labels:
    application: promtest
spec:
  selector:
    matchLabels:
      application: promtest
  endpoints:
  - port: http
What that basically does, is telling Prometheus to look for a service called “promtest” and scrape the metrics via the (default) endpoint /metrics on the http port (which is set to port 4000 in the Kubernetes service).
The /metrics endpoint reports values like that:
$ curl --location --request GET 'http://<EXTERNAL_IP_OF_SERVICE>:4000/metrics' | grep custom_metric
  % Total    % Received % Xferd  Average Speed   Time    Time     Time  Current
                                 Dload  Upload   Total   Spent    Left  Speed
100 26337  100 26337    0     0   325k      0 --:--:-- --:--:-- --:--:--  329k
# HELP custom_metric_counter_total_by_pod Custom metric: Count per Pod
# TYPE custom_metric_counter_total_by_pod gauge
custom_metric_counter_total_by_pod{pod="promdemo-56946cb44-d5846"} 1
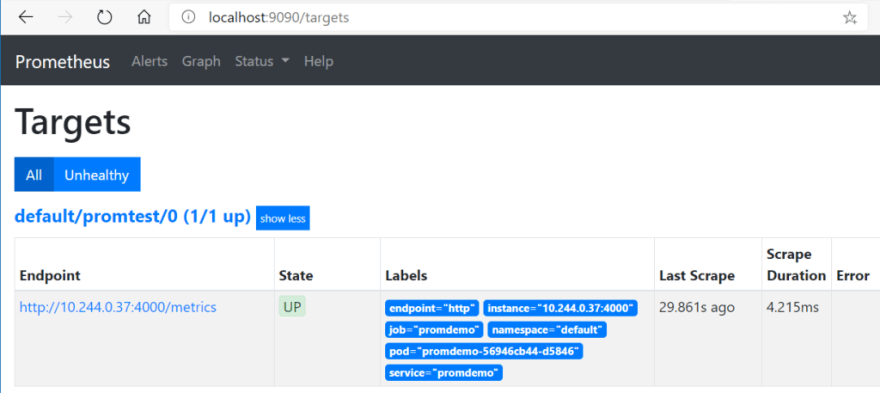
When the ServiceMonitor has been applied, Prometheus will be able to discover the pods/endpoints behind the service and pull the corresponding metrics. In the web UI, you should be able to see the following “scrape target”:
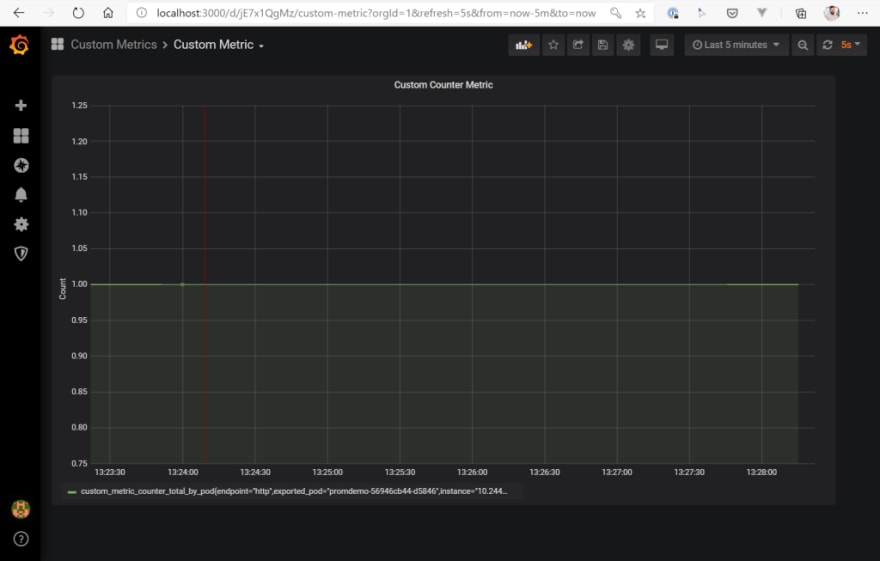
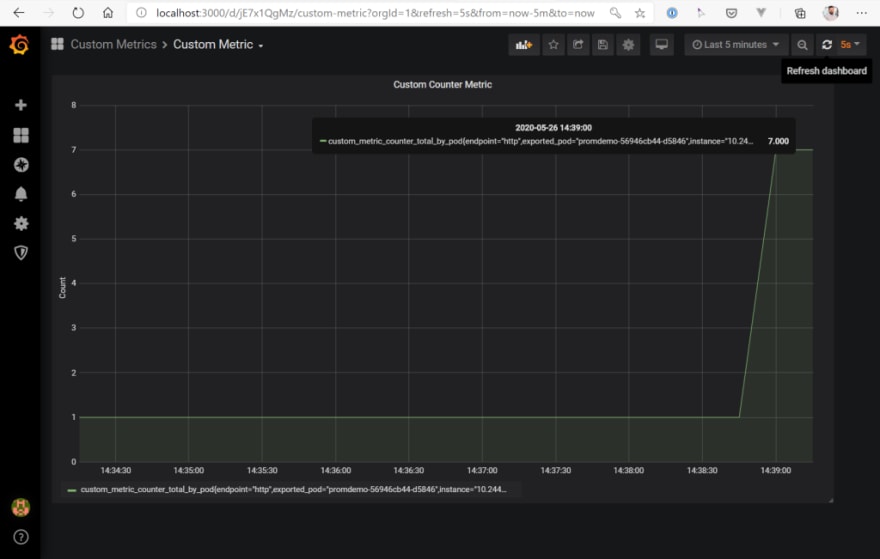
Time to test the environment! First, let’s see how the current metric looks like. Open Grafana an have a look at the Custom dashboard (you can find the JSON for the dashboard in the GitHub repo mentioned at the end of the post). You see, we have one pod running in the cluster reporting a value of “1” at the moment .
If everything is set up correctly, we should be able to call our service on /api/count and set the custom metric via a POST request with a JSON document that looks like that:
{
    "count": 7
}
So, let’s try this out…
$ curl --location --request POST 'http://<EXTERNAL_IP_OF_SERVICE>:4000/api/count' \
--header 'Content-Type: application/json' \
--data-raw '{
    "count": 7
}'
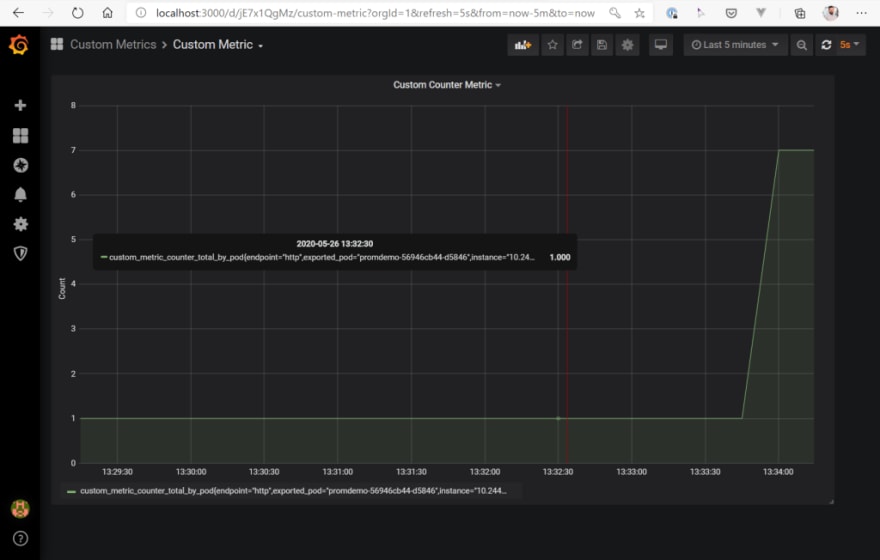
So, this works as expected. After setting the value via a POST request to “7”, Prometheus receives the updated value by scraping the metrics endpoint and Grafana is able to show the updated chart. To be able to execute the full example in the end on the basis of a “clean environment”, we set the counter back to “1”.
$ curl --location --request POST 'http://<EXTERNAL_IP_OF_SERVICE>:4000/api/count' \
--header 'Content-Type: application/json' \
--data-raw '{
    "count": 1
}'
From a monitoring point of view, we have finished all the neccessary work and are now able to add the Prometheus adapter which “connects” the Prometheus custom metric with the Kubernetes Horizontal Pod Autoscaler.
Let’s do that now.
Prometheus Adapter
So, now the adapter must be installed. I have decided to use the following implementation for this sample: https://github.com/DirectXMan12/k8s-prometheus-adapter
The installation works quite smoothly, but you have to adapt a few small things for it.
First you should clone the repository and change the URL for the Prometheus server in the file k8s-prometheus-adapter/deploy/manifests/custom-metrics-apiserver-deployment.yaml. In the current case, this is http://prometheus-k8s.monitoring.svc:9090/.
Furthermore, an additional rule for our custom metric must be defined in the ConfigMap, which defines the rules for mapping from Prometheus metrics to the Metrics API schema (k8s-prometheus-adapter/deploy/manifests/custom-metrics-config-map.yaml). This rule looks like this:
- seriesQuery: 'custom_metric_counter_total_by_pod{namespace!="",pod!=""}'
      seriesFilters: []
      resources:
        overrides:
          namespace:
            resource: namespace
          pod:
            resource: pod
      name:
        matches: "^(.*)_total_by_pod"
        as: "${1}"
      metricsQuery: sum(<<.Series>>{<<.LabelMatchers>>})
If you want to find out more about how the mapping works, please have a look at the official documentation. In our case, only the query for custom_metric_counter_total_by_pod is executed and the results are mapped to the metrics schema as total/sum values.
To enable the adapter to function as a custom metrics API in the cluster, a SSL certificate must be created that can be used by the Prometheus adapter. All traffic from the Kubernetes control plane components to each other must be secured by SSL. This SSL certificate must be added upfront as a secret in the cluster, so that the Custom Metrics Server can automatically map it as a volume during deployment.
In the corresponding GitHub repository for this article, you can find a gencerts.sh file that needs to be executed and does all the heavy-lifting for you. The result of the script is a file called cm-adapter-serving-certs.yaml containing the certificate. Please add that secret to the cluster before installing the adpater. To whole process looks like this (in the folder of the git clone):
$ ./gencerts.sh
$ kubectl create namespace custom-metrics
$ kubectl apply -f cm-adapter-serving-certs.yaml -n custom-metrics
$ kubectl apply -f manifests/
As soon as the installation is completed, open a terminal and let’s query the custom metrics API for our metric called custom_metric_counter_total_by_pod via kubectl. If everything is set up correctly, we should be able to get a result from the metrics server:
$ kubectl get --raw="/apis/custom.metrics.k8s.io/v1beta1/namespaces/default/pods/*/custom_metric_counter_total_by_pod?pod=$(kubectl get po -o name)" | jq

{
  "kind": "MetricValueList",
  "apiVersion": "custom.metrics.k8s.io/v1beta1",
  "metadata": {
    "selfLink": "/apis/custom.metrics.k8s.io/v1beta1/namespaces/default/pods/%2A/custom_metric_counter_total_by_pod"
  },
  "items": [
    {
      "describedObject": {
        "kind": "Pod",
        "namespace": "default",
        "name": "promdemo-56946cb44-d5846",
        "apiVersion": "/v1"
      },
      "metricName": "custom_metric_counter_total_by_pod",
      "timestamp": "2020-05-26T12:22:15Z",
      "value": "1",
      "selector": null
    }
  ]
}
Here we go! The Custom Metrics API returns a result for our custom metric – stating that the current value is “1”.
I have to admit it was a lot of work, but we are now finished with the infrastructure and can test our application in combination with the Horizontal Pod Autoscaler and our custom metric.
Horizontal Pod Autoscaler
Now we need to deploy a Horizontal Pod Autoscaler that targets our app deployment and references the custom metric custom_metric_counter_total_by_pod as a metrics source. The manifest file for it looks like this, apply it to the cluster:
kind: HorizontalPodAutoscaler
apiVersion: autoscaling/v2beta1
metadata:
  name: prometheus-demo-app
spec:
  scaleTargetRef:
    apiVersion: apps/v1
    kind: Deployment
    name: promdemo
  minReplicas: 1
  maxReplicas: 10
  metrics:
  - type: Pods
    pods:
      metricName: custom_metric_counter_total_by_pod
      targetAverageValue: "3"
Now that we have added the HPA manifest, we can make a new request against our API to increase the value of the counter back to “7”. Please keep in mind that the target value for the HPA was “3”. This means that the Horizotal Pod Autoscaler should scale our deployment to a total of three pods after a short amount of time. Let’s see what happens:
$ curl --location --request POST 'http://<EXTERNAL_IP_OF_SERVICE>:4000/api/count' \
--header 'Content-Type: application/json' \
--data-raw '{
    "count": 7
}'
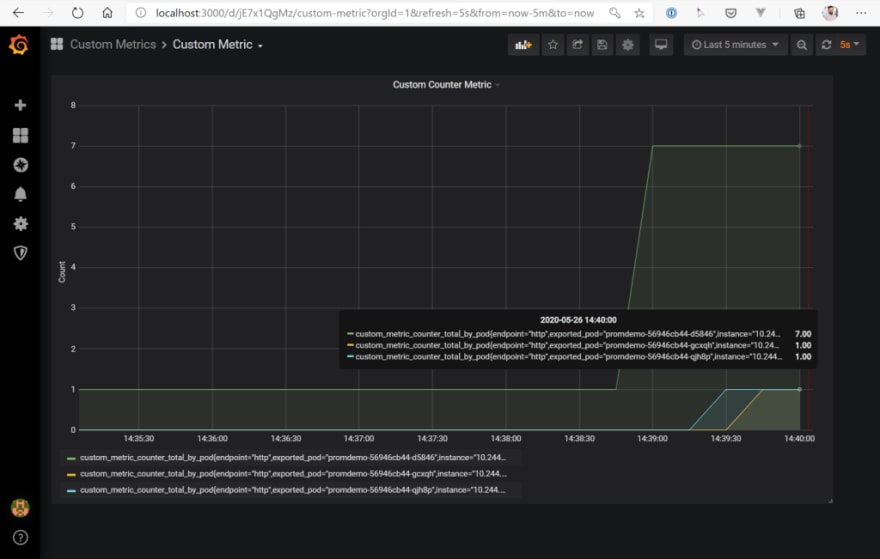
How does the Grafana Dashboard look like after that request?
Also, the Custom Metrics API reports a new value:
$ kubectl get --raw="/apis/custom.metrics.k8s.io/v1beta1/namespaces/default/pods/*/custom_metric_counter_total_by_pod?pod=$(kubectl get po -o name)" | jq

{
  "kind": "MetricValueList",
  "apiVersion": "custom.metrics.k8s.io/v1beta1",
  "metadata": {
    "selfLink": "/apis/custom.metrics.k8s.io/v1beta1/namespaces/default/pods/%2A/custom_metric_counter_total_by_pod"
  },
  "items": [
    {
      "describedObject": {
        "kind": "Pod",
        "namespace": "default",
        "name": "promdemo-56946cb44-d5846",
        "apiVersion": "/v1"
      },
      "metricName": "custom_metric_counter_total_by_pod",
      "timestamp": "2020-05-26T12:38:58Z",
      "value": "7",
      "selector": null
    }
  ]
}
And last but not least, the Horizontal Pod Autoscaler does its job and scales the deployment the three pods! Hooray…
$ kubectl get events
LAST SEEN   TYPE     REASON              OBJECT                                        MESSAGE

118s        Normal   ScalingReplicaSet   deployment/promdemo                           Scaled up replica set promdemo-56946cb44 to 3
118s        Normal   SuccessfulRescale   horizontalpodautoscaler/prometheus-demo-app   New size: 3; reason: pods metric custom_metric_counter_total_by_pod above target
Wrap-Up
So what did we see in this example? We first installed Prometheus with the appropriate addons like Grafana , Alert Manager (which we did not use in this example…). Then we added a custom metric to an application and used Prometheus scraping to retrieve it, so that it was available for evaluation within Prometheus. The next step was to install the Prometheus adapter , which admittedly was a bit more complicated than expected. Finally, we created an Horizontal Pod Autoscaler in the cluster that used the custom metric to scale the pods of our deployment.
All in all, it was quite an effort to scale a Kubernetes deplyoment based on custom metrics. In the next article, I will therefore talk about KEDA (Kubernetes Event-Driven Autoscaling), which will make our lives – also regardings this example – much easier.
You can find all the Kubernetes manifest files, Grafana dashboard configs and the script to generate the SSL certificate in this GitHub repo: https://github.com/cdennig/k8s-custom-metrics.

Top comments (0)