“Can I execute 10, 100, or 1,000 process instances per second on this Camunda 8 cluster?”
This is a typical question we get these days, and it can be answered using benchmarking. Let’s explore this fascinating topic in today’s post.
Our benchmarking journey and some technical background
Internally, benchmarking was an interesting journey, which I quickly want to recap first. From day one, one engineering goal behind Zeebe, the workflow engine within Camunda 8, was to develop a highly scalable workflow engine that can go far beyond what existing technology could do. Hence, measuring progress in the areas of throughput or latency was always top of our minds.
Feel free to skip this section if you are just interested in how to run your own benchmark in the latest and greatest way.
When we first released Zeebe in 2018, we hand-crafted a benchmark setup using AWS, Terraform, and Ansible. This setup created a Zeebe cluster alongside a simple load generator using the Zeebe Java client and then measured process instances started per second. While this was a good starting point, it was not yet great.
This first approach to running a benchmark resulted in two major lessons learned:
- We did not look at the right metrics. “Process instances started per second” is easy to measure, but this number does not tell you if those processes can be completed, or if you simply start a big wave of instances that pile up. Hence, a more interesting metric to look at is “process instances completed per second”.
- Service tasks need to be taken into consideration. For every service task, the workflow engine internally needs to create a job, pass it to a worker and wait for its completion. Those computations compete upon resources with other computations.
Let’s use the following example process:

To complete this process, the workflow engine needs to:
- Create the new process instance
- Manage “Do A”
- Manage “Do B”
- Manage “Do C”
- Complete the process instance
Now the computations around completing those three service tasks compete with the computations around process instance creation. This means that if you start process instances too fast, you will likely not complete all service tasks anymore and this means, process instances will not be completed but pile up instead. This is also why the Zeebe engine will apply backpressure on process instance starts. Note that the current design favors service tasks over starting process instances, as service tasks completions will not receive any backpressure.
This is all interesting, but what does that mean for benchmarking? Basically, we need to balance process instance starts and service task completions. Our first attempt to do so was around 2019 when we created more realistic scenarios. In a nutshell, we said:
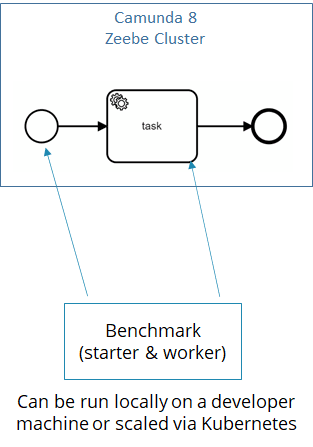
- We need to create a starter application that will create process instances at a defined rate, passing on a defined payload.
- We also need a worker application for completing service tasks. We wanted it to behave realistically, so we simulated a delay in job completion. We used 100ms as a typical delay the completion of an external REST service takes.
We packaged both as Java applications and allowed to configure, deploy and scale them via Kubernetes. Since then, we used those benchmark starters regularly and you can for example see it in action here.

First attempt to automate benchmarking using multiple starter and worker pods
But there were still two problems that regularly hit us:
- Having two independent applications and containers for starter and worker means, that they are, well, independent of each other. But in reality, they need to be balanced (because of the competition between process starts and service tasks). This balancing had to be done manually. This was difficult even for experienced people and often led to wrong conclusions.
- We needed to scale those starters and workers to fully utilize our Zeebe clusters. The way the starters and workers were built required a massive amount of hardware. This lead to expensive benchmarks and hindered adoption, as not every customer can easily spin up huge Kubernetes clusters.
So we did a further improvement round:
- We combined the starter and worker into one Java application
- We added a balancing algorithm that tries to find the optimal rate of process instance starts. Optimal means that we make sure all started process instances can be processed and completed while utilizing Zeebe at maximum capacity. The algorithm can use backpressure to adjust. While this algorithm is probably far from being optimal yet, it is a good starting point and allows incremental improvements, which we are currently working on.
- We consequently applied asynchronous/reactive programming correctly and leveraged the scheduling capabilities of the Java platform. This reduced the required hardware for the starter application massively and allows us to use a small machine to utilize even large Zeebe clusters. Yeah for reactive programming!
This seems to work great. We now have a tool, where a simple Java application can benchmark Zeebe clusters without requiring much knowledge about how the benchmark works internally. The balancing algorithm should optimize itself. This tool is made available as a Camunda community extension (https://github.com/camunda-community-hub/camunda-8-benchmark) and can serve as a starting point for your own benchmarks.
Now we run benchmarks controlled by one application that balances itself
Benchmarking vs. sizing and tuning
At this point, I want to throw in another important thing I have learned over the last years doing benchmarks: You have to be clear about your objective!
There are different things you can do:
- Sizing to find the cluster configuration that can fulfill a given goal.
- Performance tuning on a Zeebe cluster, e.g. figuring out if giving it 2 vCPUs more yields in an improvement that is worth the investment and makes this cluster configuration better.
- Efficiency tuning , e.g. finding resources that are underutilized in a given cluster, meaning other parameters are the bottleneck. By reducing those resources you can save money.
- Benchmarking to understand the maximum throughput on a given cluster.
Most often in the past, we did all of the above at the same time. Whenever we defined a cluster configuration (e.g. for our cloud SaaS service), we obviously benchmarked it. Running a benchmark might also yield some insights on performance bottlenecks, which can lead down a route of either performance or efficiency tuning. This will lead to an improved cluster configuration, which requires another benchmark run. This is an optimization loop you can basically do forever :-) The following diagram expresses this process:

You might already guess see the important trick: You need to be happy with the cluster configuration at some point in time. This can be hard, as engineers have a good instinct that the current configuration is not yet optimal (spoiler: it might never be). Still, you have to stop optimizing and accept a good enough configuration.
Also remind yourself, that no benchmark can ever be 100% realistic and therefore numbers should be taken with a grain of salt. My general recommendation is to stop tuning your cluster probably earlier rather than later, live with some fuzziness around throughput numbers, but then calculate enough buffer that you can cope with a reduced throughput for whatever reason. A typical rule of thumb is to size your cluster to accommodate at least 200% of your expected load. If you expect big peaks, this number might be even higher, to be able to guarantee throughput in peak times. You can also find some more thoughts about defining goals in our best practice “Sizing your environment”.
The metrics we are looking at
Let’s summarize all the important metrics we are looking at in our benchmarks:
- PI/s : Process instances per second. In general, while we need to control the rate of started process instances, we should always measure the completed process instances per second.
- Backpressure : The benchmark also records the number of requests per second that were not executed because of backpressure. This rate gives you a good indication of the utilization of your cluster. Our experience is, that a cluster that fully utilized its hardware resources, gives around 3–10% backpressure.
- Tasks/s : As discussed, every service task comes with an overhead. And typically, one process instance comes with many tasks, the default benchmark we run contains 10 tasks as kind of an average. That means if we want to complete 333 PI/s we need to be able to complete 3330 Tasks/s. In the Camunda context, you might also see FNI/s instead, which means flow node instances per second. A flow node is every element in a BPMN process, so not only the service tasks, but also the start event, gateway, or the like. While this is the most precise metric, it is also the most abstract one. This is why we look at Tasks/s or PI/s instead, as this can be much better understood by a variety of people.
- Cycle time : For some processes, cycle time is important. For example, in a recent customer scenario around trading, we needed to guarantee that process instances are completed within 1 second.
A sample benchmark
Let’s walk you through an example.
Therefore, I will benchmark a Camunda 8 SaaS cluster of size “S” with our“typical” process and a “typical” payload.
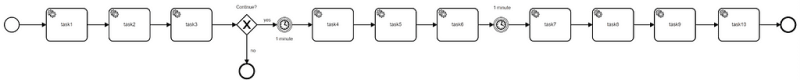
The process contains 10 service tasks, one gateway, and two timers waiting for one minute each. I provide the following configuration parameters to the camunda-8-benchmark project:
- benchmark.startPiPerSecond=25: We start with a rate of 25 PI/s and the benchmark will automatically adjust to an optimal rate from there. While this number does not matter too much, the closer you are to the target the faster the benchmark will reach an optimum.
- benchmark.taskCompletionDelay=200: Simulate this delay of task completion for every service task.
With our two timers having a 1-minute delay each, and 10 service tasks having a 200 ms delay each, the cycle time must be at least 2 minutes and 2 seconds for “business” reasons.
Starting the benchmark, you can look at what’s going on using the provided Grafana Dashboard. In the beginning, it will increase the start rate, as the cluster is underutilized and no backpressure is reported:

After a while though, especially when service tasks kick in more and more, we will see backpressure and the start rate is slowly reduced. Now, you basically have to wait some minutes for the system to find a good optimum. In the picture below you can see the first 30 minutes of the benchmark. It took roughly 10 minutes to get to a relatively stable state.
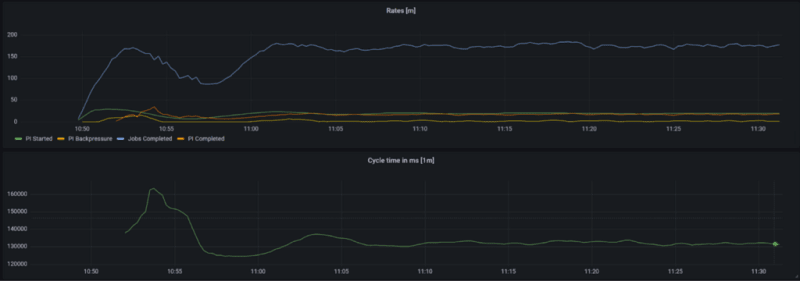
From this benchmark run, we can then derive throughput and cycle time numbers. Ideally, you should look at those numbers only after the initial warm-up phase.

The result is:
- We can run roughly complete 17 PI/s on this cluster (as you can see, the number of started and completed process instances are roughly the same, which is good)
- Service Tasks/s (= Jobs/s) is roughly 10 times PI/s, which makes a lot of sense given our process has 10 service tasks.
- The cycle time is about 133s, which is not far off the 122s calculated optimum. For most cases, this cycle time is totally great, if latency matters for your use case it might make sense to investigate a bit and optimize for it, which is a topic for another day.
This video also walks you through running this benchmark.
Just as a side note: Of course, you can also use Camunda Optimize to see the process-related data (like count and cycle times) related to this benchmark. It’s less nerdy but even easier to use :-)

Running your own benchmark
No go and run your own benchmark using https://github.com/camunda-community-hub/camunda-8-benchmark. As described, one benchmark application might be sufficient to put smaller clusters under load. You can also run this starter via docker or on Kubernetes and scale it. You don’t necessarily need to adjust or configure anything but the Zeebe endpoint, but most often you want to adjust the BPMN process model, the payload, and the simulated time a service task will take. Please have a look at the readme of the benchmark project for details.
“Our production system doesn’t process anywhere near what the benchmark results showed!”
As mentioned, a benchmark can never be 100% realistic. Still, you should try to mimic realistic behavior to get valuable results and insights. The most important things to consider to make it realistic are:
- Use a process model close to what you plan to do. Do you have many service tasks, gateways, or timers? Create a process model that also has them (quick disclaimer: we have not yet built message correlation logic into the benchmarking tool, this is something for another day).
- Use a payload (aka process variables) that is close to reality. If you follow our best practices around handling data in processes, you should not have much data in process variables. But sometimes, users put a big JSON payload in a process variable, which can impact performance heavily.
Having said this, I wanted to add that it is a good idea anyway to follow our best practices to build process solutions that will run smoothly in production.
Running bigger workloads
In today’s post I looked at the smallest cluster we offer in Camunda SaaS. While 17 PI/s is actually sufficient for most use cases out there, it is of course not the big number we love to brag about. I am currently preparing another blog post to describe a scenario that my colleague Falko benchmarked for a customer in the financial industry. They run 6000 PI/s successfully while keeping the cycle time below one second. Wow!
Next steps
If you look at the benchmarking procedure closely, you will notice, that it concentrates on benchmarking the Zeebe workflow engine itself. If you look at, for example, the history architecture of Camunda 8, you can see that there are other components that are also important to keep up with this load, most prominently Camunda Operate and Camunda Optimize. Currently, we still have a gap there (which is why the official numbers provided with Camunda 8 are lower than the ones above). To address this, we currently add the other components to the benchmark chain and adjust metrics again. So a completed PI might also need to be visible in Operate and Optimize to count, for example.
Conclusion
Running a benchmark to figure out what your Zeebe cluster can do is easy using the camunda-8-benchmark community extension. To get started, you might only need a developer machine that is connected to the internet.
Bernd Ruecker is co-founder and chief technologist of Camunda as well as the author ofPractical Process Automation with O’Reilly. He likes speaking about himself in the third person. He is passionate about developer-friendly process automation technology. Connect viaLinkedIn or follow him onTwitter. As always, he loves getting your feedback. Comment below orsend him an email.

Top comments (0)