
In this article, I introduce you to report-toolkit, show you its coolest features, and help you get up and running with the new technology. Since Diagnostic Reports is a relatively new feature in Node.js and is still considered experimental, I'll start with a brief overview.
Node.js Diagnostic Reports: The basics
In this section, I explain what Diagnostic Reports are and how to generate them.
For a more in-depth overview, check out Easily Identify Problems in your Node.js Apps with Diagnostic Report, written by Gireesh Punathil, a Node.js TSC member.
What are Node.js Diagnostic Reports?
Originally introduced in Node.js v11.7.0 as an experimental feature, a Diagnostic Report is a JSON file (or JavaScript object) containing a diagnostic summary of a Node.js process. Diagnostic Reports are especially helpful for post-mortem debugging or situations in which it's impractical to attach a debugger.
A Diagnostic Report's summary contains information about the state of a node process, including:
- Process information (static information which lives in the Process object) including the version of Node.js and the versions of its dependencies
- Operating system, platform, and CPU information
- The state of the JavaScript and native (C++) stacks
- Memory and resource usage
- The state of the
libuvevent loop - Environment variables
- Shared libraries
- Metadata about the report file itself
As of this writing (the current version of Node.js is v13.5.0), Diagnostic Reports is still considered experimental. Practically speaking, that means the usage, API, or output may introduce breaking changes at any time in both the LTS (v12.x) and current (v13.x) release lines.
That being said, the underlying implementation has proved itself robust in the months since its arrival, and I don’t expect it to be a source of problems for early adopters.
Next, I show you the magic spell you need to generate a report. And by magic spell, I mean command-line flags.
How do I generate a Node.js Diagnostic Report?
For this section, I recommend you use a version of Node.js between v12.5.0 and v13.1.0, inclusive. The API and output has not changed within this range. Newer versions may break the following assumptions, due to Diagnostic Reports' experimental status.
As with other experimental features, you need to supply node a flag. That flag is --experimental-report. In your shell, use it like so:
node --experimental-report <my-script.js>
The above command configures the node process to expose the global process.report API, and allows you to use other command-line flags to configure automatic report generation.
The most straightforward way to create a Diagnostic Report is to use the API. You can use node to run an inline script which calls process.report.writeReport(), like so:
node --experimental-report --eval "process.report.writeReport('report.json')"
You will see console output (on STDERR) like this:
Writing Node.js report to file: report.json
Node.js report completed
(node:66875) ExperimentalWarning: report is an experimental feature. This feature could change at any time
A file, report.json, will now live in your current directory. Open it in your editor, take a gander, and ponder the arcane wisdom contained therein.
You should now have a basic grasp of the what, why and how of Diagnostic Reports in Node.js. Given these fundamentals, you’ll better understand the motivation behind report-toolkit.
Introducing report-toolkit for real this time
While Diagnostic Reports are useful in solving a certain class of problems, the reports themselves can be impenetrable and tedious to work with. With feedback from the Node.js community, I designed report-toolkit to pave over the common speedbumps, and arrive more quickly at solutions.
report-toolkit is packaged as a command-line app (rtk), providing subcommands (think git) which map to a set of unique, purpose-built features. I’m going to start with what I believe is the most rad feature: automated analysis.
Analyze Diagnostic Reports with report-toolkit
Deep in the forest of a production filesystem, a developer happens upon a Diagnostic Report file. Taking stock of the surroundings, the developer discovers a process is not running. Experience and reasoning leads the developer to deduce, “These are the remains of a Node.js process.”
What happened here? How did this process meet its untimely demise? report-toolkit can help with the investigation.
rtk’s inspect feature runs a set of rules on one or more reports. Each rule is a function, and aims to provide analysis which is “good enough” — in other words, these are heuristics. If a function finds something bad, smelly, or otherwise dubious, rtk inspect will report this to the developer.
These rules are inspired by ESLint’s concept of a rule. Each rule is modular, each rule is configurable, and best of all: you can write your own and share!
report-toolkit ships with a small set of built-in rules to recognize some known problems — these include CPU and resource usage thresholds, long timeouts in the event loop, and mismatched shared library versions. As more developers adopt Diagnostic Reports (and, hopefully, report-toolkit) to solve problems, we aim to ship widely applicable heuristics as they are uncovered by the community. For other more environment-specific needs, rtk can use heuristics published as third-party modules (as “plugins”) or even just a script on disk.
Let's look at rtk inspect in action.
The following image is the output from running rtk inspect on a report file which notes that the system shared libraries in use by openssl (libcrypto and libssl) are not from the version of openssl which Node.js expects. It expects v1.1.1b, but it has been compiled against v1.1:

As another example, the rtk inspect element shows a Diagnostic Report that indicates suspiciously high CPU usage:
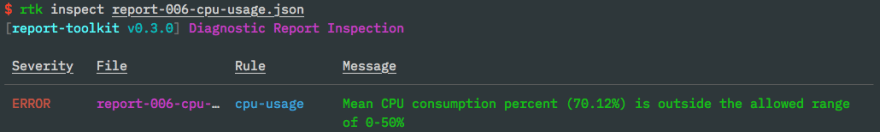
The above check takes the number of CPU cores into account, which otherwise would require the developer to do math, and nobody wants to do that.
Please stay tuned for tutorials on creating your own plugins!
The next feature we'll look at is less flashy, but extremely helpful: redaction of secrets.
Automatically redact secrets from Diagnostic Reports using report-toolkit
As mentioned above, Diagnostic Report contains the entire contents of your environment variables. This includes things like cloud provider API keys, tokens, session IDs, etc. The data is in a .json file, and as we are all careful and security-conscious developers, we must take great care of how and where we transmit this file.
You may be tempted to hand-edit these secrets out of the file, but
report-toolkit provides a redact feature, which — as you may have guessed — redacts commonly known secrets and phrases from the environment variables in a Diagnostic Report file.
Secrets include those used by major cloud providers, including IBM Cloud, AWS, Azure, and Google Cloud.
If you like to look at regular expressions, you can take a look at the matching.
Instead of obliterating the key outright, the value is replaced with the string [REDACTED].
Let's look at this feature in action. Take a Diagnostic Report containing the following:
{
  "environmentVariables": {
    "CLOUD_PROVIDER_ACCESS_KEY": "MY_SUPER_SECRET_KEY"
  }
}
Now, run rtk redact /path/to/report.json. rtk will dump the entire report to your terminal. The result will contain:
{
  "environmentVariables": {
    "CLOUD_PROVIDER_ACCESS_KEY": "[REDACTED]"
  }
}
I recommend using the --replace option to rtk redact, which overwrites the file in-place instead of printing to STDOUT. If you’re leery about that, try --output <new-filename>, which will create a new file from the redacted Diagnostic Report.
Another task report-toolkit helps with is comparison of Diagnostic Reports.
Comparing Diagnostic Reports with report-toolkit
Suppose you have two Diagnostic Reports generated from a single node process. Or two reports generated from the same script, but on different machines. Or two reports from different processes on the same machine. Or whatever—you have two reports, OK?
You could use diff report-1.json report-2.json. Or diff it in vim or some other GUI tool. That will (eventually) get the job done. But these tools weren’t made to compare Diagnostic Reports; they were made to compare arbitrary text files and source code.
rtk, on the other hand, provides a diff command purpose-built for Diagnostic Reports. It hides generally uninteresting information (certain timestamps and JSON syntax) and provides a helpful side-by-side view, noting what has been added, modified, or removed between the left and right reports.
Example output from rtk diff <report-1.json> <report-2.json> looks like this:

Above, note the differences between header.processId (good for checking if the same process created both reports), the current working directory, the command-line flags to node, and finally the different versions of Node.js used to create the reports.
rtk diff allows explicit including and excluding of field names (using “dot” syntax), in case there’s something you want to zero in on, or ignore; rtk diff report-1.json report-2.json -i header.nodejsVersion would only compare the Node.js version values.
Having worked with Diagnostic Report files, Alice & Bob notice the files contain much JSON; each is around 25KiB. Alice and Bob may not need all that information, or maybe they need it in a different format; this is a problem report-toolkit helps solve via transformers. Read on, Alice and Bob!
Transformation of Diagnostic Reports with report-toolkit
Transformers, in report-toolkit parlance, can be thought of as “mapping” functions. When performing a transformation, report-toolkit starts with a Diagnostic Report, maps it through one or more transformers, and finally produces output.
report-toolkit ships with a handful of built-in transformers intended for general-purpose use. However, I’d like to train the spotlight on a transformer tailored to a specific use case: identification of unique uncaught exceptions.
When an uncaught exception is thrown in Node.js, best practices recommend that the process does not attempt to resume normal operation. Instead, it should exit. A typical recovery strategy, then, is to just restart the process. The service is back online, and a developer can begin a post-mortem investigation as appropriate.
To aid in post-mortem debugging, Node.js can be configured to automatically generate a report in the case of an uncaught exception (using --report-uncaught-exception).
The reason behind any given uncaught exception may very well be a bug — but it also might be due to circumstances outside of developer control, such as network outages or Martian invasion. By examining the Diagnostic Report and its stack trace, a developer can identify an exception as “known” or, less charitably, “somebody else’s problem.”
Yet, this doesn’t answer the questions: “How many of these are out of my control and how often?” or “How many JIRA tickets do I need to create and assign to myself?”
To count chickens, one must know a chicken.
report-toolkit can help developers count chickens using the stack-hash transformer. This transformer computes a SHA1 hash of the exception—establishing unique exceptions — and outputs the hash along with the complete stack trace. Pipe this into a data store, and now you’ve got some lovely metrics for your favorite dashboard.
The output looks something like this:
{
  "dumpEventTime": "2019-11-21T15:18:47Z",
  "filepath": "report.json",
  "message": "Error: your problem",
  "sha1": "9c1d91a8e0f6944e0c0bc920c55e64145c3823a8",
  "stack": [
    "at Object.<anonymous> (/path/to/script.js:1:7)",
    "at Module._compile (internal/modules/cjs/loader.js:956:30)",
    "at Object.Module._extensions..js (internal/modules/cjs/loader.js:973:10)",
    "at Module.load (internal/modules/cjs/loader.js:812:32)",
    "at Function.Module._load (internal/modules/cjs/loader.js:724:14)",
    "at Function.Module.runMain (internal/modules/cjs/loader.js:1025:10)"
  ]
}
In a future release, report-toolkit will allow a user to customize which information is used to compute the hash.
We've just scratched the surface of transformers in report-toolkit. To learn more — and see a list of built-in transformers — check out report-toolkit’s quick start guide.
Conclusion
Ideally, this article gave you an understanding of the fundamentals of Diagnostic Reports in Node.js, and the ways in which report-toolkit can help you use them more effectively to solve problems. Yes.
Give feedback about report-toolkit
report-toolkit is a brand new (announced October 2019) Apache-2.0-licensed OSS project from IBM, created and maintained by me, Christopher “boneskull” Hiller.
While I'm busy writing more docs, I hope you can give it a try — I’d love your feedback.
These are my questions for you:
- What worked well?
- What didn’t work well? How could it be better?
- Found a bug? Any feature requests?
- Other questions?
Please drop an issue in report-toolkit's issue tracker. All contributions are welcome!
This article originally appeared December 19, 2019 on developer.ibm.com.


Top comments (0)