
Written by Zain Sajjad✏️
Redux is one of the most adopted state management libraries for large scale React applications. Besides its ability to make your application more predictable, the ecosystem that has evolved around it makes Redux the best solution for large scale applications. Another advantage of Redux is the developer tool that makes it easy to trace when, where, why, and how your application’s state has changed.
We will look into some extraordinary features that Redux DevTool offers that can help you debug your applications faster.
Tracing actions
Another amazing feature of Redux DevTools is to see the call stack that has triggered the action. We can select any action from history and see the cause of action.
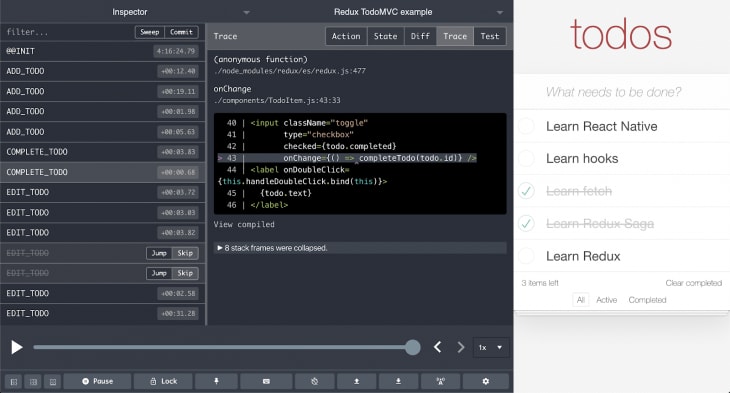
For large scale applications where the same actions are triggered simultaneously from different parts of apps, it is hard to get to the root cause of action dispatch. Here is where the trace feature comes in handy for developers.
Redux DevTool allows developers to either use default implementation that relies on Error.stack() or define custom implementation. Here is the API to enable trace:
window.__REDUX_DEVTOOLS_EXTENSION_COMPOSE__({
    trace: true, // (action) => { return ‘trace as string’; }
    traceLimit: 25,
 })
As seen, the trace argument also accepts methods. This method is called with every action. Developers can add custom implementation here to see the cause of action dispatch. Passing this method against trace property allows developers to monitor the trace of desired actions only.
This can help in keeping the development experience smooth and performant, as creating trace for every action might consume a lot of memory. The method as trace can be helpful for action dispatched via side effect libraries like redux-saga or other event listeners.
When not implementing a custom trace method, developers can rely on default implementation that uses Error.stack() API. In this case, traceLimit property is useful to manage memory usage of DevTool. It overrides browser defaults of Error.stackTraceLimit and limits the length of the stack for optimized memory consumption.

Tracing actions in the editors
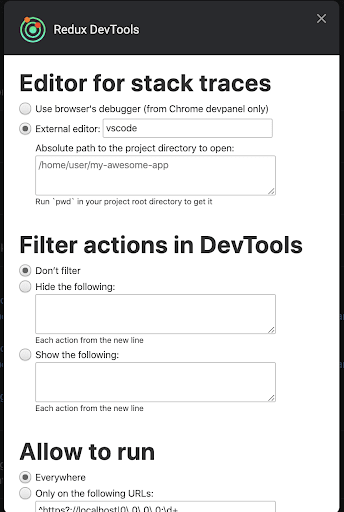
Extending the ability to show trace of action, Redux DevTool allows you to navigate to the exact point of the codebase. For large codebases, this can be super handy, as it saves tons of useful time to navigate to the exact location in a large codebase.
The editor can be set from extension settings that are available at the bottom right of the DevTool.
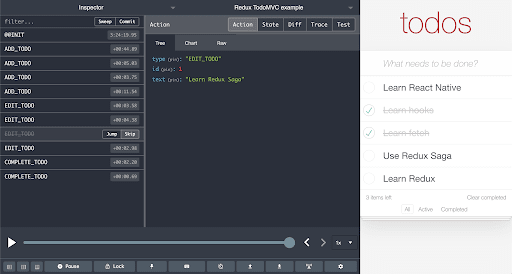
Skipping actions
Time travel is one of the most powerful features of Redux DevTools, it allows us to see how our app’s state has reached the current point. In certain cases, to analyze application behavior, we might need to remove a particular action from the timeline. This is not possible within the time travel mechanism. Redux DevTool has a great way of doing it. Out of three different view types for your application’s flow, log monitor and inspector allows you to disable or remove an action from the timeline. Here is how it looks.
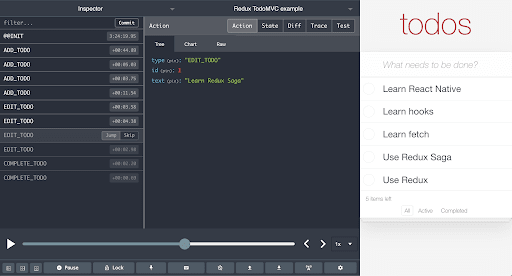
Jumping to action
Besides skipping state from timeline, developers can jump to a desired state without having to move through the timeline. This enables developers to quickly move around and see app’s output on different intermediary states. Developers can monitor the impact of jump in the timeline as well. This feature is only available with inspector mode.
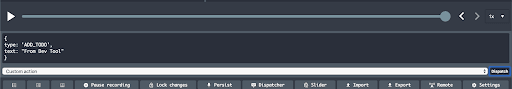
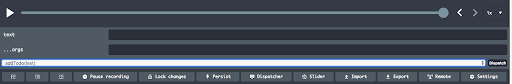
Custom dispatch
Redux DevTool allows us to dispatch actions without writing any code. We can add our actions in dispatcher and it works just like action dispatched via Redux API. This kind of mocking helps in testing side effects and dependent actions. This feature becomes really handy when coupled with locking to the current state. We can lock state to a certain stage and dispatch action from DevTool to see the impact on store and monitor side effects.
Blacklist/whitelist actions
For large scale applications consisting of a number of actions, we can monitor only desired actions or another way around is to blacklist certain actions from appearing in DevTool. This can be done by adding a blacklist or whitelist of actions in DevTool settings or while initializing it in our applications.
window.__REDUX_DEVTOOLS_EXTENSION_COMPOSE__({
    actionsBlacklist: 'SOME_ACTION',
  // or actionsBlacklist: ['SOME_ACTION', 'SOME_OTHER_ACTION']
  // or just actionsBlacklist: 'SOME_' to omit both
 })
As seen we can use actionsBlacklist / actionsWhitelist parameters in an argument at initialization or do it via settings.
Persist store on page reload
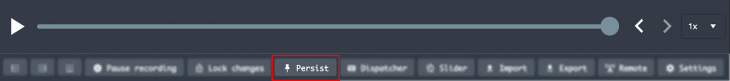
One of the pain points in large scale applications is the development of interfaces for state that is derived after a journey within the app. It becomes even harder when some of the states depend on side effects, for example, network responses. DevTool comes to the rescue, we can persist certain states of ours across page reloads. This will allow you to jump directly to the desired state after reloading without going through the journey again.
This can be done by clicking the “Persist” button in the bottom bar or adding ?debug_session= to the URL.
Using in production
It is very hard to predict or catch all possible bugs in our apps. We encounter a number of issues after our applications are live in production and are used by a large number of users. In order to analyze those bugs, we might need to see the trail of actions or current state of our application when the issue occurred. DevTool allows us to see a trail of actions and store in production as well, making it easier to reproduce issues.
For security and performance, it is highly recommended to use action and state sanitization options. Here is a blog post that looks at enabling DevTool in production.
Locking to the current state
In applications where several actions are dispatched frequently, we might need to analyze our application at an intermediate position without allowing further actions to be dispatched. This can be achieved by locking our app to the current state. Unlike pausing, this freezes our application to the current state. When the application is locked we can still do time travel and other enable/disable dispatched actions.

The other benefit of locking is that we finally have a solution to avoid side effects.
Pin to sub state
In most production apps, state is divided in small sub state objects usually reflecting different modules in apps. Debugging cases might require focus on a particular sub state. For such cases, developers can pin to sub state and see how different actions impact this pinned sub state. Sub state can be pinned from Inspector & Chart modes.
Commit actions
For large scale applications, it is never easy to go through the list of hundreds of actions. Rather developers prefer to monitor the application in chunks. For such cases, Redux DevTool allows developers to commit the current set of actions. Current state is then considered as the initial state for upcoming actions. One of the best uses of this feature is monitoring state across page transitions.
Once committed, you can also revert back to this state anytime. In other words, you can add pivot to your state and come back to it whenever required.

Developers can commit state from Inspector mode but to Revert have to switch to log monitor.
Conclusion
Without a doubt, Redux DevTool is one of the most useful and powerful tools for debugging React applications. It allows developers to leverage predictability of application provided by Redux to the full extent. It is also available within the React Native debugger, which is why knowing it to a full extent can pace up our development and debugging on the web and mobile platforms simultaneously.
Full visibility into production React apps
Debugging React applications can be difficult, especially when users experience issues that are difficult to reproduce. If you’re interested in monitoring and tracking Redux state, automatically surfacing JavaScript errors, and tracking slow network requests and component load time, try LogRocket.
LogRocket is like a DVR for web apps, recording literally everything that happens on your React app. Instead of guessing why problems happen, you can aggregate and report on what state your application was in when an issue occurred. LogRocket also monitors your app's performance, reporting with metrics like client CPU load, client memory usage, and more.
The LogRocket Redux middleware package adds an extra layer of visibility into your user sessions. LogRocket logs all actions and state from your Redux stores.
Modernize how you debug your React apps — start monitoring for free.
The post Redux Devtools: tips & tricks for faster debugging appeared first on LogRocket Blog.

Top comments (0)