
I’ll admit it, I don’t always use a debugger to figure out what’s going wrong in my program. If my mouse clicks start printing documents down the hall, then it’s time to break out the most powerful of all debugging tools: the console.
The reason is quite simple. When a program is interactive, involving a break-step debugger becomes tedious and interrupts the flow. In times like these, it’s easier to just jump into a few key places in the code and trace the program’s state to figure out where the program is taking a wrong turn.
Displaying objects
The console.log method, and its friends console.warn and console.error, lets you dump objects in the console. The only difference between these functions is their “type” classification, which looks slightly different and can be filtered when viewing the console output.
For example,
console.log(document.head, document.body);
Will output something like the following, depending on the browser (this is from Firefox, but the general functionality is the same across browsers):

In most browser implementations, this will display an interactive list of the specified JavaScript objects’ properties, with an expandable tree view of the objects.
There’s also console.dir, which lets you do the same for a singular object, but there’s a slight difference in the representation.
For example,
console.dir(document.head)
Will output the following:

The only notable difference between the two is that, when printing an object, console.log gives special treatment to HTML elements, while console.dir displays everything as plain objects.
Note : There’s also console.exception, but this is just an alias for console.error.

Writing formatted strings
The other form console.log and friends take is a printf-like formatted string, followed by any number of substitutions. The format isn’t as rich as printf, but it does support some of the common variants like strings with %s, integers with %d or %i, and objects %o and %O.
For example,
for (let i = 0; i < 10; i++) {
  console.log(
    "%s I've been called %d times, this is the document body %o",
    "Hello", i, document.body
  );
}
Will result in the following being displayed, with the objects interactive as if they were used in the other variant of console.log:

There is one more substitution you can use — actually, it’s more like an escape sequence — that lets you style how the text appears in the console with CSS. That’s the %c substitution.
For example,
console.log(
  "%c The quick %c brown %c fox jumps over the %c lazy dog",
  "font-size: 34px;",
  "font-size: 24px; color: brown;",
  "color: orange;",
  "color: black; font-weight: bold;"
)
Will be rendered as the following:

Displaying object tables
If you have a lot of data you want to look at, like a map or an array of objects, then console.table does a great job of rendering that as tabular data.
For example,
var animals = [
  { kind: 'Horse', name: 'Henry', age: 43 },
  { kind: 'Dog', name: 'Spot', age: 13 },
  { kind: 'Cat', name: ' Mittens', age: 18 },
];
console.table(animals);
Will be rendered like the following table:

Let’s say you only want to display a few key columns. You can avoid the step of mapping them into new objects by passing an array containing the desired column names as the second parameter when calling console.table.
For example,
console.table(animals, ['kind', 'name']);
Will render a table like this:

Tracing function calls
The console.trace method lets you dump a stack trace in the console — in other words, the path the runtime took to call that function — which is useful in tracking down the function responsible for passing bad data.
For example,
function foo() {
  bar();
function bar() {
    console.trace();
  }
}
foo();
Will output a stack trace like this:

Counting function calls
Sometimes you want to keep track of how often a block of code is called; console.count does just that. Simply provide the string it’s supposed to track, and every time it’s called, it does the counting. This is particularly useful when dealing with user input and events.
For example,
window.addEventListener('click', function(event) {
  console.count(event.type);
  console.log(event);
});
Will result in something like the following output:

To reset a counter, you just need to call console.countReset with the label, and it will reset back to zero.
Grouping information
Finally, there’s the console.group, which visually groups information together in a collapsible list, increasing the indentation by one per level.
For example,
console.group('First group');
console.log('First message');
console.group('A group inside the first group');
console.log('A message inside the group inside the first group'); console.log('Another message inside the group inside the first group');
console.groupEnd();
console.log('Second message'); console.groupEnd();
Will result in the following output:

Inspecting state
In addition to the console object, which is supported across browsers and even in Node.js, there are some functions and variables available in the browser’s developer console. Do take note, however, that these are vendor-specific, and the subset supported here varies between browsers.
For example, the $_ variable holds the most recent expression that was evaluated in the console context:

And $0 through $4 holds the most recent element that was inspected with inspect element:

Again, these are browser-specific, unlike the console object. Google Chrome has many more utility functions, which are documented here. Again, though, don’t expect them to work in other browsers.
Conclusion
Printing to the console is a great way to visualize things. If something simple helps solve a complex problem, why make it harder for yourself with a complex solution?
Having the flow and state visualized can really be a lifesaver, so don’t be afraid to use it. Just because something is simple doesn’t mean it’s for beginners only. I’ve been logging to the console for a decade, and I plan to do it for another one.
PS To any of my old colleagues reading this: I’m sorry for using up all your printer ink.
Plug: LogRocket, a DVR for web apps
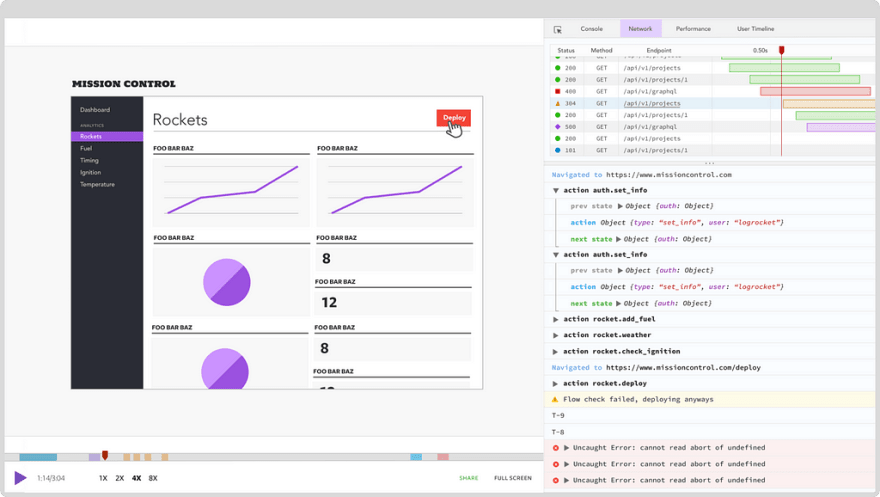
LogRocket is a frontend logging tool that lets you replay problems as if they happened in your own browser. Instead of guessing why errors happen, or asking users for screenshots and log dumps, LogRocket lets you replay the session to quickly understand what went wrong. It works perfectly with any app, regardless of framework, and has plugins to log additional context from Redux, Vuex, and @ngrx/store.
In addition to logging Redux actions and state, LogRocket records console logs, JavaScript errors, stacktraces, network requests/responses with headers + bodies, browser metadata, and custom logs. It also instruments the DOM to record the HTML and CSS on the page, recreating pixel-perfect videos of even the most complex single-page apps.
The post Keeping it simple with the JavaScript console appeared first on LogRocket Blog.


Top comments (0)