
Written by Diogo Souza✏️
Ensuring a high level of performance is key when developing any application, whether it be an API, a frontend app, or a backend app.
Despite the importance of performance, performance testing and debugging is more easily forgotten than you might think.
Regarding React-based applications, hundreds of good articles out there already focus on strategies for eliminating performance issues, identifying and killing bottlenecks, and evicting common bugs that usually lead to memory leak, out of memory, or deadlock errors.
However, when it comes to applications that grow fast, deal with a large amount of concurrent data, or include lots of complex flows nested together, things can get a bit tricky and hard to predict — even testing and debugging.
And that’s when solid tools come into play. Knowing how they work is just the first step.
You get to use it frequently, adapt your daily routine as a dev to continuously measure how a new feature is performing, and judge whether it’ll impact existing ones.
Once you get used to automating tests and continuous integrations and deliveries, automating your performance tests goes way smoother.
This article will focus on the tools part.
We’ll dive into the current best solutions in terms of profiling: the Chrome Performance tab, the Profiler from React Chrome plugin DevTools, and the React official Profiler API.
This way, you’ll have a better notion of what options are available and which one suits your use case best.

Performance profiling with Chrome Performance tab
React is already famous for its performance. That’s one of its best flagships during these years. With its virtual dom, efficiency is a well-known feature every developer trusts.
However, you also know that no silver bullet exists and, when some of your components start to get too slow to render or some nested structure you used to be proud of doesn’t perform so well anymore, that’s when you have to stop and analyze the whole thing.
We’ll start with the Chrome Performance tab, a great resource to find issues not only for React, but any front-end application you may develop. That’s a great approach since it is framework/lib agnostic, which means that the knowledge you get here can be used for future projects in other stacks.
First, some dependencies:
- You must have installed Node, npm and React (16+) in development mode;
- Google Chrome, or Chromium, DevTools (it already comes within the browser).
In order to understand it better, we need a project sample to play with.
To maintain the focus of the article, we’re going to use one of the official React example projects: the pokemon search app.
Clone it to your local machine and run the following commands:
npm install
npm start
Then, the screen below will prompt in your browser:
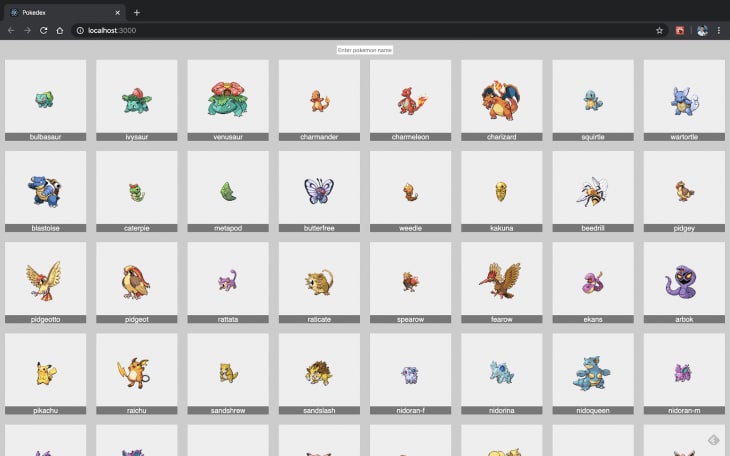
Pokedex React app running locally
For the Chrome plugin to work with React, you should be running the app in development mode. Once the application we’re using is created with this setting on, you don’t have to worry about it.
Now, open your Chrome DevTools and go to the Performance tab. There, you’ll see the following interface:

Performance tab overview
Some considerations must be taken here: this gear, when toggled, enables the option available at number 4. They’re important to fine tune the way your profiling records are going to be made.
We have three buttons here that, respectively: toggle a new record, start a new profiling by reloading the page, and clear the current record. We also have more inputs to determine if you want to take screenshots of the screen navigation/rendering, and the same with the memory usage.
We’ve mentioned the controls — here, it’s important that you select at “CPU” item, the option “4x slowdown”. This will help to test the page within an emulated environment where the computer is supposed to be slower in processing.
Now, go to your http://locahost:3000/, start the record button, and play around with the Pokemon app. It’s important not to record for more than 20 seconds, because Chrome can become too slow with too much data to process.
The result depends on a lot of variables such as machine setup, CPU and memory, internet connection, etc.
So, don’t worry if yours are not the same as mine — the important thing here is to understand how the tool works.
The image below represents the record of my tests:

Report recording example
The most important thing is stated at number 1: that segmented red bar up there in the timeline makes explicit that something is taking too long to process (usually related to CPU consumption). Those are a good starting point to investigate.
Note also that each process is colored differently in order to facilitate the identification of how much resources each group (Script files, Painting, images, etc.) is consuming at number 2.
Number 3 shows the history of loading for each of these groups in the timeline. But the section “Main” is not very useful to us, because it shows too much: all JavaScript function calls, event triggerings, etc. Instead, we’re going to use the section “Timings” (see image below).
This is because React provides a lot of metric data through the User Timing API. It’s a good way to track the timing certain actions are taking in your JavaScript files and centralize the information in a native feature of the browser.
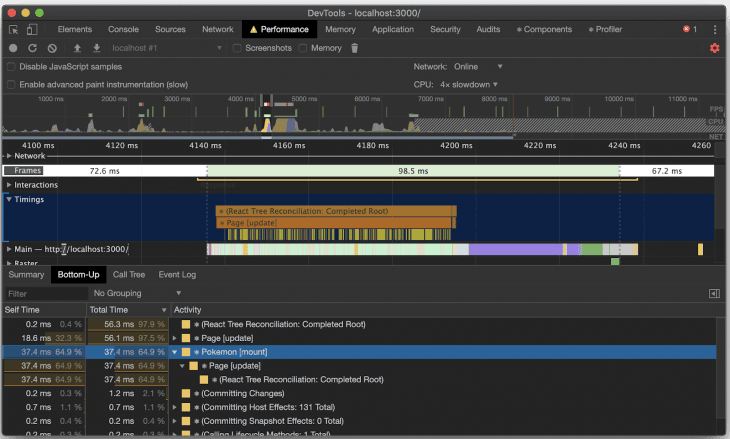
Exploring the Timing section
To explore this section, click in one of the Timing tiles (note that the React ones come with the React logo at the beginning of the tile), go to the bottom menu called “Bottom-Up,” and sort the results by “Total time” in descending order.
Here, you can see how much time each React component is taking to finish, as well as the percentage from the total processing time. Once you know the time each one is taking, it’s easier to identify where the gaps are, and act on them.
Also, DevTools prints after each activity (between brackets) in the hierarchy of the type of action performed (update, mount, etc.).
The column “Self Time”, in its turn, represents the aggregated amount of time accumulated until that specific activity.
It’s good to get a better impression of how much time already elapsed until that point.
If you want to have even more control over where exactly the problem is, you can configure your project to use a source map.
Source maps are a sort of shortcut to the real and unminified version of your JavaScript code. In other words, it combines a generated map from the transformed code (beautified, minified, etc.) to the original source code, letting the browser know exactly how to reconstruct the original one for debugging purposes.
Performance profiling with React DevTools
Before going any further on this part, you have to install the React Developer Tools extension. The profiler works by default only in development mode.
Currently, there’s a way to run in production mode with the feature activated too: just follow up this link if you’re interested.
Usually, frontend developers deal with this extension only to inspect React components, but it goes beyond that. You can check the performance of the components as well within the Profiler tab.
React DevTools overview

Take a look at the image above. Here, we have four main parts of the extension.
First, we have the two default tabs that come within the extension.
The first one, components, is the most famous. There you can find the nested stack of React components and check their state.
The second one refers to the profiling mechanism. Here we have pretty much the same buttons of the Chrome Performance tab. Their functioning is similar as well.
These three tabs refer to the way your profiling results will be shown. We’ll get to this soon.
The gear will opt out a bunch of options to tune how the profiling must be taken. We’ll let everything default here.
Now, let’s go to the recording. Open your Pokedex application again, click the “Start profiling” button shown in number 2 (previous image), and play around with the app.
After finishing, click the same button again to stop the recording.
The results should be similar to the image below:

Pokedex DevTools profiling result
This is the result of the flamegraph, a flame chart that shows the total time each component took to render, already ordered by the length of the tile.
DevTools also introduces the concept of commit, which is similar to the self time we’ve seen in the Performance tab, i.e., when React in fact applies the changes to the DOM.
The colors here are not random — actually, they’re important. Yellow tiles mean that they’d taken longer to complete.
The green-blue ones say they were pretty fast in rendering. In the screenshot above we don’t have the third color, grey, but it represents components that did not take any time being rendered (or re-rendered) for that commit.
However, if you navigate to the other commits using the arrows in the top side of the tab, you’ll get to see some components in grey, since they weren’t involved in any updating by React.

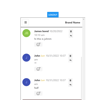
Ranked tab result with component rendering history
The image above shows the visualization by the “Ranked” tab. Note that it is focused on timing.
After you click any component on the left side, the right side section will update with all the history information of that component, regarding when it was and how long it took to be rendered.
On the other side, if you click on any item of the timetable, you’ll see the left-sided section updating with the tiles stacked in a visual representation of the same history.
Be aware that if you have too complex of a React componentization, some custom rules will be necessary to better filter the results. For this, go to the gear icon we’ve mentioned and explore its options.
The Profiler API
From React 16.4 on, you can benefit from a new component called <Profiler/> that belongs to the React’s Profiler API. It helps to customize your metrics from the source code, measuring time for your component’s lifecycle.
Its usage is very straightforward: you just need to add the tag anywhere in your code you wish to collect how costly the rendering is. There’s just two possible props: a string id and a callback function to be called after each commit is performed.
Let’s adapt the Pokedex app to collect some metrics. Open the project in your favorite IDE and go to the cmp-page.js. Then, update your import React statement to the following:
import React, { Component, unstable_Profiler as Profiler } from 'react'
After that, above the render function, add the following:
onRenderCallback = (
    id, // the "id" prop of the Profiler tree that has just committed
    phase, // either "mount" (if the tree just mounted) or "update" (if it re-rendered)
    actualDuration, // time spent rendering the committed update
    baseDuration, // estimated time to render the entire subtree without memoization
    startTime, // when React began rendering this update
    commitTime, // when React committed this update
    interactions // the Set of interactions belonging to this update
  ) => {
    console.log({id, phase, actualDuration, baseDuration, startTime, commitTime, interactions});
}
This callback function will simply print all the props provided by React profiler. You can check the description of each one on the code snippet itself.
Next, change the render function content to the following:
<Profiler id="pokemon_profiler" onRender={this.onRenderCallback}>
    <li className="pokemons__item" key={pokemon.id}>
        <Pokemon pokemon={pokemon} />
    </li>
</Profiler>
Here’s the output example you can check at your console:
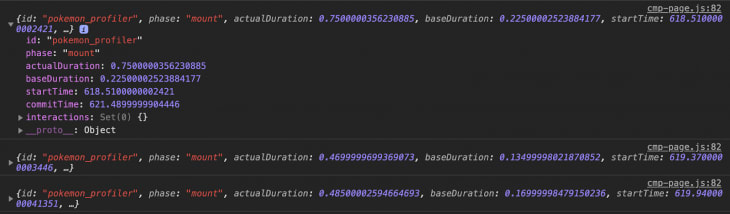
Profiler result output
One of the pros of this approach is that you can implement the conditions over the profiling based on your own desire. You don’t have to log everything.
You can, for example, create alarms that’ll warn you when something is too slow. This will allow you to feel safer when it comes to trusting your implementations, or trusting that new code won’t mess with the running application.
Conclusion
There are many tools, as we’ve seen so far.
The real question is: how do we extract the best from each of these tools to suit any situation we might come across in our projects?
Furthermore, how do we adapt and get used to using them in our daily lives as devs, in order to get faster feedback about what we’re coding?
Personally, I think that a mixed approach would suit your needs better than using a single tool. You can learn which feature of each tool works best for you and your team and then adapt your process and tests overtime using graphs, logs, alarms, metrics, filters, etc.
There are many distinct ways you can customize your profiling actions, so give them all a chance. Test, collect, analyze, and finally decide. That’s a good cycle to trust.
If you have other tools of your own or techniques to measure performance in React, please comment below and let us know.
Full visibility into production React apps
Debugging React applications can be difficult, especially when users experience issues that are difficult to reproduce. If you’re interested in monitoring and tracking Redux state, automatically surfacing JavaScript errors, and tracking slow network requests and component load time, try LogRocket.
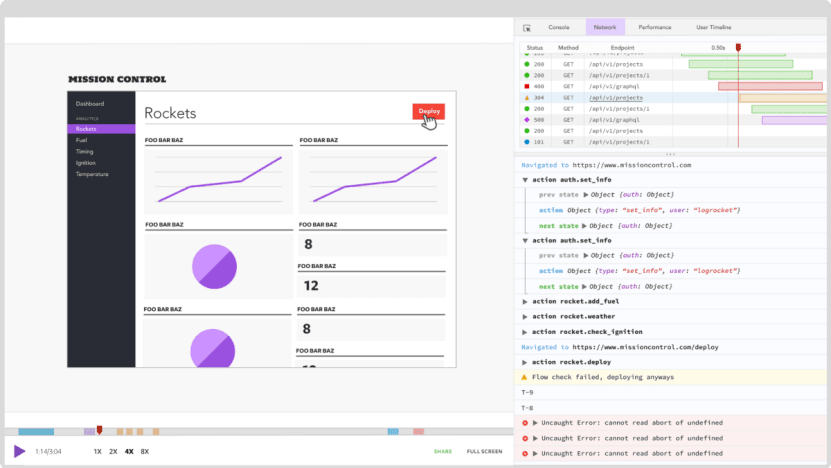
LogRocket is like a DVR for web apps, recording literally everything that happens on your React app. Instead of guessing why problems happen, you can aggregate and report on what state your application was in when an issue occurred. LogRocket also monitors your app's performance, reporting with metrics like client CPU load, client memory usage, and more.
The LogRocket Redux middleware package adds an extra layer of visibility into your user sessions. LogRocket logs all actions and state from your Redux stores.
Modernize how you debug your React apps — start monitoring for free.
The post Debugging performance problems in React appeared first on LogRocket Blog.


Top comments (0)