How to understand your choreography using process events monitoring
Enterprises that use event-driven microservices often suffer from a lack of visibility into processes that cross the boundary of one individual microservice. It‘s’ hard to understand what happens and why.
In this blog post I will introduce process events monitoring as possible remedy. Before I can do that, I will briefly explain a typical event-driven architecture and the resulting challenges. Feel free to skip this part if you know what I am talking about. Last but not least, I will link a concrete example and recording, showing all of this in action, using Camunda Optimize.
Choreography and event-driven microservices
Microservices can use events to communicate among each other. I often use a simplified order fulfillment process to visualize what this could look like. Whenever somebody places an order, an event is fired from the checkout service and picked up by a payment service. The payment service now collects money and fires an event which gets picked up by the inventory service. And so on:

Another example I used in the past is an account opening process, where a new customer wants to open, for example, a new bank account:
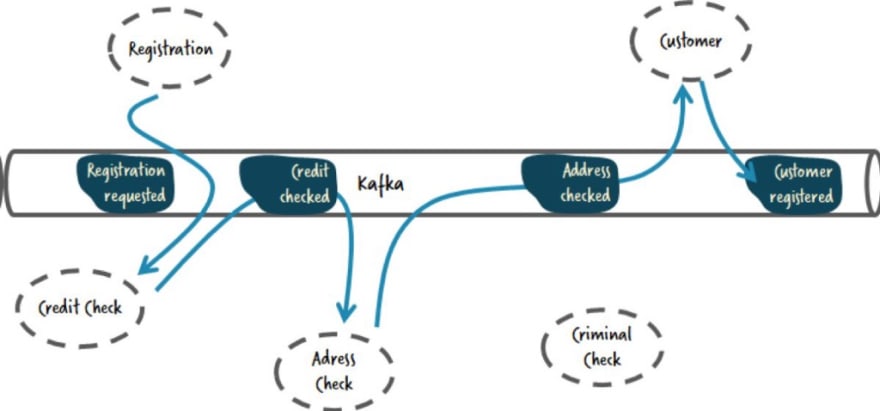
This is known as choreography, as in order to get something done the various microservices communicate directly with each other using events. There is no component orchestrating another to steer the process. This is meant to decouple the microservices, but as I discuss in How to tame event-driven microservices I don’t agree with that simplification. But this is not the topic of today's post.
Event-flows and the challenge of visibility
The above examples result in event-flows. An overall (business) process is carried out by a number of event notifications in a certain sequence, as multiple microservices need to be involved.
A huge challenge in such architectures is to understand how the overall process is actually carried out, as this knowledge is spread among various event notifications. As Josh Wulf from Credit Sense said (full disclosure: Josh in the meanwhile has joinedCamunda as Developer Advocate): “the system we are replacing uses a complex peer-to-peer choreography that requires reasoning across multiple codebases to understand.”
And there is a lot of proof for this problem, for example Martin Fowler wrote in What do you mean by “Event-Driven”:
The danger is that it’s very easy to make nicely decoupled systems with event notification, without realizing that you’re losing sight of that larger-scale flow, and thus set yourself up for trouble in future years.
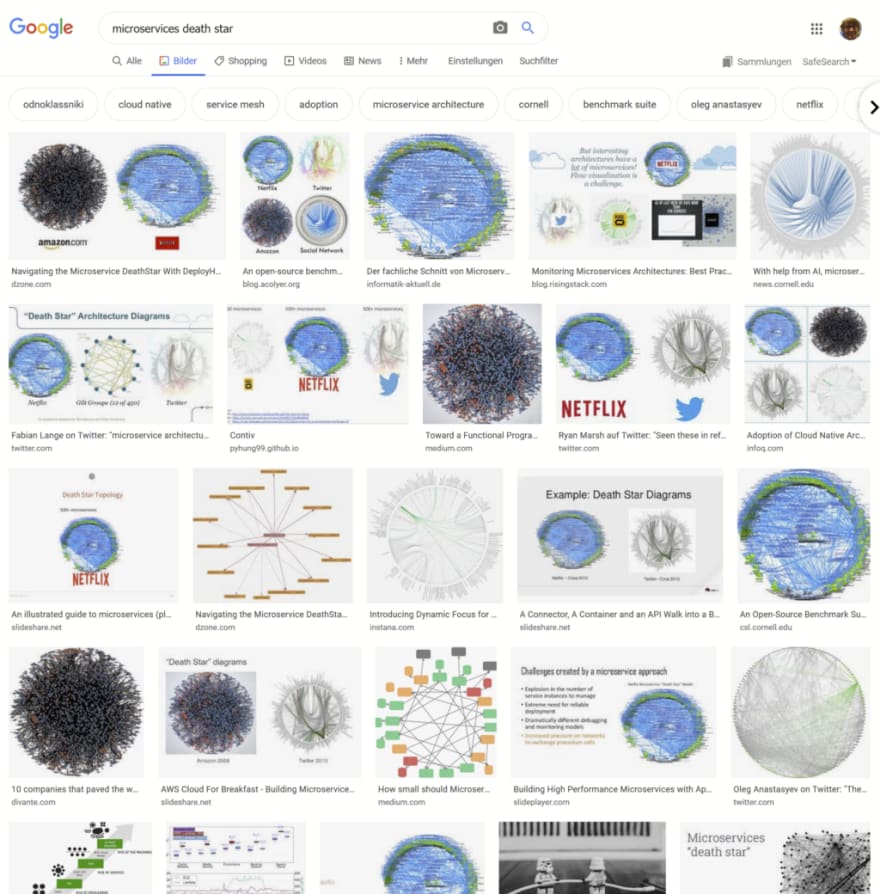
Stefan Tilkov referred to this emergent behavior as“aka what the hell just happened. Google finds nice pictures of what is already called the “microservice death star”:
Or Phil Calando used the term pinball machine architecture for their experiences at Meetup: https://twitter.com/berndruecker/status/1143621604980797440
And there are many articles on visibility in microservices architectures, e.g. Business process visibility & event-driven services, Visualizing and tracking your microservices, How To Operationalize Monitoring For Akka & Lagom Microservices, or Netflix Conductor: A microservices orchestrator.
This was also confirmed by a survey we did back in 2018 where we asked the participants about the challenges they faced with microservices architectures:

TL-DR: This problem is quite relevant!
This lack of visibility leads to severe consequences. First, you have no graphics you can leverage to understand and discuss requirements between various stakeholders, from business people to developers. Second, all graphics that will be drawn to mitigate this will be at least out-of-date, most probably even wrong.
Third, operations will have a hard job. In case there are any errors, you are missing context. Looking back at our shipment example — if the shipment can’t be created because the input data is corrupt, you have no context as to why this order ended up there with that wired data. Even worse, you have no easy way to recognize that processes are stuck, as nothing will recognize if the shipment service never emits an event, leading to silently unfulfilled orders.
Fourth, you have no easy way to analyze the overall performance of the process. What are typically bottlenecks? Which path does the process take? Do we have many canceled orders if we need to wait for payment too long? Quite hard to answer, as the required data is spread across various microservices.
TL-DR : This problem is severe!
Monitoring processes across boundaries
In Monitoring and Managing Workflows across Collaborating Microservices I described typical approaches I see customers using to conquer this challenge:
- Distributed tracing (tools like Zipkin or Jaeger)
- Data lakes or business analytic tools (e.g. Elastic)
- Process mining (tools like ProM)
As that article discusses, distributed tracing is too technical, misses the business perspective, and cannot tell you anything about next steps in a process that got stuck. So you might have no idea what is blocked by the error at hand and how to move on.
Elastic and similar tools are great, but require effort to set up and configure, especially if you want to provide a proper business perspective. For example, you might collect all events and correlate them to one process instance, but the resulting list of events does not yet tell you much about the structure of the underlying business process.
Process mining tools typically focus on log file analysis and not on event-driven architectures, making them hard to apply in microservice architectures.
Process events monitoring
The missing link is to monitor events on a process level.
With some customers I validated a process tracking approach, where a workflow engine was used in a pure listening mode, so that incoming events start or advance process instances. While this works well overall, not everybody wants to run a workflow engine for that, and the big downside is that you can’t easily analyze data from before you introduced the tracking approach.
This is why we added event-based processes in our monitoring and reporting tool Camunda Optimize.
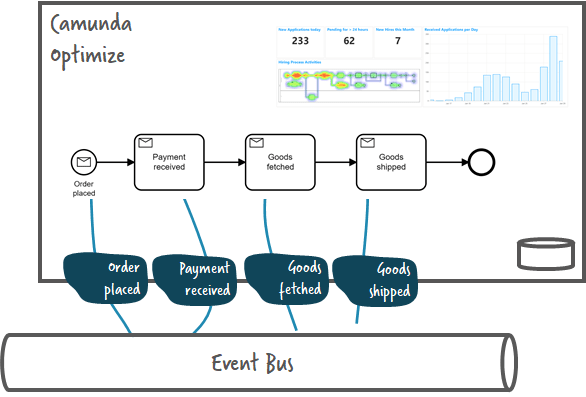
This allows to define a process model simply for monitoring, and then map events to certain activities:

Events can be ingested from various sources using the Cloud Events standard. As a result you can monitor the order fulfillment process on a business level, for example, by defining a report that shows a heatmap of duration, in this case showing that fetching the goods is the slowest activity (simplified example, I know, but I hope it sparkles your imagination):

I also discussed this exact scenario in a recent webinar called “Monitoring & Orchestrating Your Microservices Landscape using Workflow Automation” (recordingand slidesavailable).
You can read about the detailed features of Optimize on the product homepage.It basically addresses the challenges stated above. For example, you can see if your processes are running smoothly or hitting bottlenecks with visual BPMN heatmaps. You can build powerful reports, dashboards and alerts. This will also allow you to monitor service level agreements (SLA), e.g. if orders are fulfilled within 2 days.
The level of detail of the BPMN model can be decided depending on your (business) requirements. You can even build multiple models, so for example one more high-level end-to-end process and some more detailed parts of a process, which you want to analyze in-depth.
Sample application
In order to better understand the nature of a choreography, and play around with process events monitoring, you can use flowing-retail sample application, available on GitHub. It implements a complete order fulfillment process. The following recording walks you through the application running the choreography and using Optimize for process events monitoring:
https://medium.com/media/92771cace8820e203c522c7595808734/href
Flowing-retail uses CloudEvents on Apache Kafka to communicate. Here is one example of a CloudEvent:
{
  "type": "PaymentReceivedEvent",
  "id": "84075871-68d3-4e0c-8e58-ef4b543c5869",
  "source": "Payment-Choreography",
  "time": "2020-06-20T08:09:19.963Z",
  "data": {
    "orderId": "3a648179-b3ad-4d36-b6df-0d409d68461f",
    "paymentId": "aaf2d2b4-0acc-49b4-a861-55276d0b15b2"
  },
  "datacontenttype": "application/json",
  "specversion": "1.0",
  "traceid": "e6ff7cf4-90e5-4e14-a3e6-2d0b12cecf09",
  "group": "flowing-retail"
}
Optimize can understand this format directly, but you have to push it to Optimize using its REST ingestion API (some more information on the event ingestion format and API can be found in the docs).
This makes the event ingestion from Kafka simple. You basically have to build a small component that subscribes to Kafka and send all events over to Optimize. You can find the source code I used here: https://github.com/berndruecker/flowing-retail/tree/master/kafka/java/camunda-optimize-ingest. You could wrap that into Kafka Connect if you prefer, and, of course, you can do similar things for every other technology you use.
Please note that Optimize is not included in the Camunda Community Edition and thus you need a trial for the Enterprise Platform. With the credentials you get there, you can run Optimize via Docker.
Conclusion
In this blog post you could see that process visibility is a huge challenge in an event-driven choreography. Traditional approaches (especially around observability, distributed tracing or data lakes) are not an optimal solution.
Process events monitoring adds the business perspective on processes, implemented by event flows. You can model a process purely used for monitoring and analysis, allowing a level of intelligence you only know from processes implemented on a workflow engine.
Camunda Optimize added process events monitoring capabilities in the recent release, which is the beginning of an interesting journey I am super stoked about. If you have feedback (or questions of course) don’t hesitate to reach out!
Bernd Ruecker is co-founder and chief technologist of Camunda. He likes speaking about himself in the third-person. He is passionate about developer-friendly workflow automation technology. Connect via LinkedIn or follow him onTwitter. As always, he loves getting your feedback. Comment below orsend him an email.

Top comments (0)