Originally published on https://badgerbadgerbadgerbadger.dev/generating-the-mandelbrot-set/
Update
The shared github repo for the end product of this post is in version 2 state. @lovasoa kindly contributed a pull request which massivley improved performance and allowed the rendering to happen at full screen with much better speed and taught me many things in the process. I've added these improvements as an updated section at the end of the post. Many thanks @lovasoa. The first version, on which most of this post is based is still available for perusal at https://github.com/ScionOfBytes/smooth-mandelbrot/tree/v1.0.
Intro
A few weeks ago, somewhere in late April, I became fascinated with the Mandelbrot Set. I came across an interesting video by Ben Sparks on Numberphile where he speaks of them. He starts off with the idea of stable iterations first, on a one-dimensional number line and then, on a two dimensional complex plane, demonstrating how-- on iterating on the square of a given number-- the result can either blow up and tend towards infinity or remain stable and tend towards 0. Or at least that's the idea I got. Someone more math-y correct me if I'm wrong.
The visualisations in the video were quite nicely done and I got an itch to try them myself. My best friend has been studying Daniel Shiffman's Code! Programming with p5.js for Beginners and that reminded me of my own early years in programming when I kept myself motivated by building trippy animations and other cool stuff you can do with a library like p5.js (though back then only Processing existed).
So I thought, why not try my hand at generating the Mandelbrot Set?
Complex Numbers
First, we need to talk about Complex Numbers. There are a ton of videos on YouTube about Complex Numbers. I won't go into the details of what they are exactly or why they exist. Let's just say that for our purposes we can think of complex numbers existing on a line perpindicular to our regular number line. If you take a piece of graph paper and mark a line from left to right, and then another line that crosses that line at 90 degrees, from top to bottom, you can imagine that the horizontal line represents the real number line, and the vertical line represents the complex number line. This gives us a Complex Plane to work with.
I highly suggest watching the videos I've linked to really grasp the ideas behind Complex Numbers and how they represent a plane, but for the purpose of this post, let's just say we have a grid and two numbers to work with, one number representing a horizontal position on the grid, and one representing a vertical. And these give us a point.
The Mandelbrot Set
The Mandelbrot set starts with the idea of iteration. Say you have a number z. This is a complex number of two parts, but for now let's imagine it's a simple number.
Let's square z giving us z2. Let's take another number c and add it to our result to get z2 + c. Let this be our new z.
We have the operation z' = z2 + c
We can do this again but this time, instead of our original z we are using our new value z'. This way, we keep feeding the result of the previous operation into the next one. We keep iterating like this until we have a reason to stop. We can start with a value z = 0, but it's the c that's noteworthy here.
The Mandelbrot Set, as I understand it, is the set of all numbers in the Complex Plane that, when put under this iteration, does not blow up. The c in our equation is the number we're testing.
In this context, if, upon iteration the value of z becomes larger than 2 at any time, we consider it to have blown up. At this point we know that it will tend towards infinity.
So, when speaking of the Mandelbrot set what we do is, for each point in our grid, we test to see if, when put under iteration via the z' = z2 + c operation, where c = the point, if the value blows up, then the point is not part of the Mandelbrot Set. And if it does not, then it is.
Honestly, this is all very math-y and I am going to stop with the Math now. I highly recommend you watch the above videos for a solid understanding of Complex Numbers and the Mandelbrot Set. From here on out, I will be talking mostly code.
Let's say we have a grid of pixels, and each pixel can be represented by x / y coordinates. Let's also say that we have a function (the programming kind, not the math kind) testMandelbrot which takes a coordinate c and tells us if c is in the Mandelbrot Set or not. That function and most of the math we need to perform is in this file. As you can see, it requires very little code.
For a proper understanding of why all this math is happening (and especially if my attempt to explain wasn't sufficient), have a look at these videos.
- The Mandelbrot Set - Numberphile - More about the Mandelbrot Set.
- Mandelbrot Set on Vsauce - A very entertaining and educational video by the beloved Michael Stevens.
And then read this excellent little page by Karl Sims-- Understanding Julia and Mandelbrot Sets by Karl Sims-- this one helped me a lot.
Early Attempts
My first attempt was semi-successful. I made many mistakes, wrote a lot of messy code, and managed to get something going that rendered very slowly even for a 450 x 200 resolution canvas. You can find it here. If you play around with the resolution, you will notice that upping it slightly to 600 x 350 will make it render significantly slower than the initial 400 x 200 setting. This is no surprise. It might only be an increase of 200 pixels horizontally and 150 pixels vertically, but overall, there are now 30K more pixels to scan than before.
I also have a version of this with cleaner code on https://openprocessing.org (this one), but I stressed it out too much in terms of resolution and openprocessing is taking too long to render it.
This is how it looks, by the way:
I decided it was running slow because it was in Javascript. I am ashamed to say that even after five years of working in the industry I still have such naive thoughts. The truth is my code was merely bad and lacking any sort of polish or optimisation.
So the next step of my plan was to try to do the same thing in Processing 3.
I started small:

And then went a tiny bit bigger.

These took way too long to generate, though, with the first one clocking in at 2251 ms and the second at 7869 ms.
I was still making mistakes here. I was using a full package to do the complex math and several other overly complicated things. There wasn't a noticeable performance gain over the JS code.
And then I decided to do something really stupid. I wanted to see a highly zoomed-in version of the Mandelbrot Set and admire the beautiful fractal patterns. So I thought, why not make a really large image and then zoom into that using a regular image viewer and admire the fractals that way?
So I tried to generate a 12000x10000 image. That's 120 million pixels. A 120 mega-pixel image. I tried to generate that on my laptop. And I made a royal mess of it, too. Not only did it take over an hour to do, I forgot to save it, so just to show you guys that image I'll have to let my laptop run hot for an hour, again, and it won't even be that great an image. You'll get to see it anyway.
But let's take a step back.
I didn't want to just make a 120 megapixel image. I wanted to make a 12 gigapixel one. But the moment I tried to allocate an array that large, JVM told me to stick my head where the sun don't shine. Okay, 12K x 10K it would be. I wanted this image to look extra special so I decided to make some smaller ones look really good as practice.
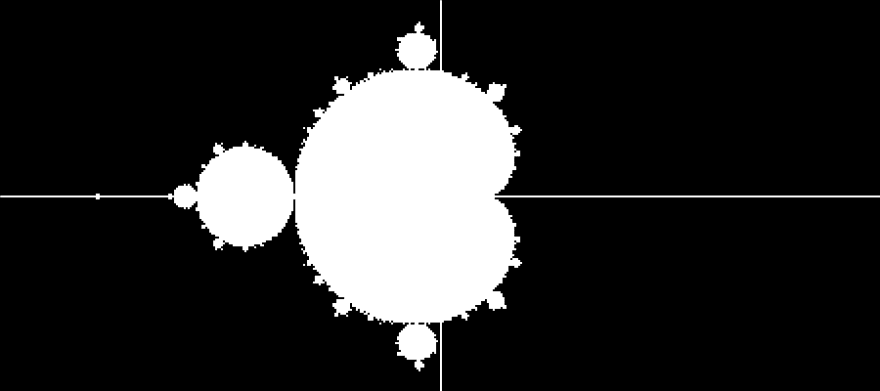
First a 1200 x 1000 that took 38,785ms:
This is pretty nice looking, actually, but let's see if we can do something prettier.

For each of the points not inside the Mandelbrot set, I'm taking the number of iterations it took before it blew up and mapping that from 0 - 200 (since 200 is the maximum number of iterations I'm checking) to 0 - 255 (8 bit greyscale color range).
Now we can not only see the scattered Mandelbrot islands, we can also see the connections between them. These connections are too thin to show up on such a low resolution image, but the surrounding shading gives them away.
Let's try something in another color.
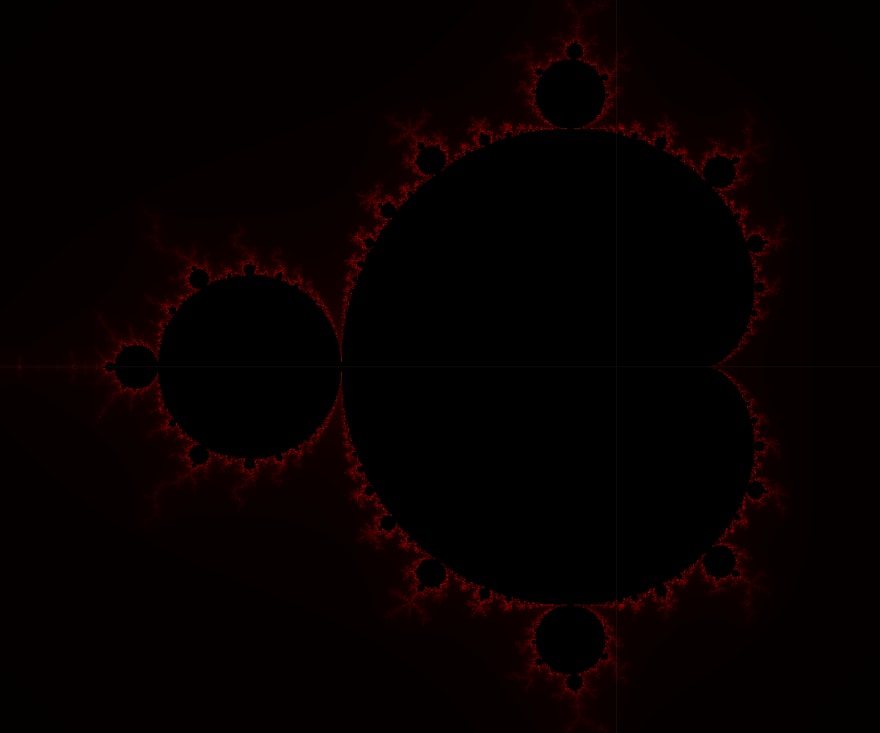
For this I decided to color the inside of the Set fully black, and let the outside be mapped from 0 (full black) to #FF0000(full red), giving us a vivid red border.
Let's do something even more colorful.
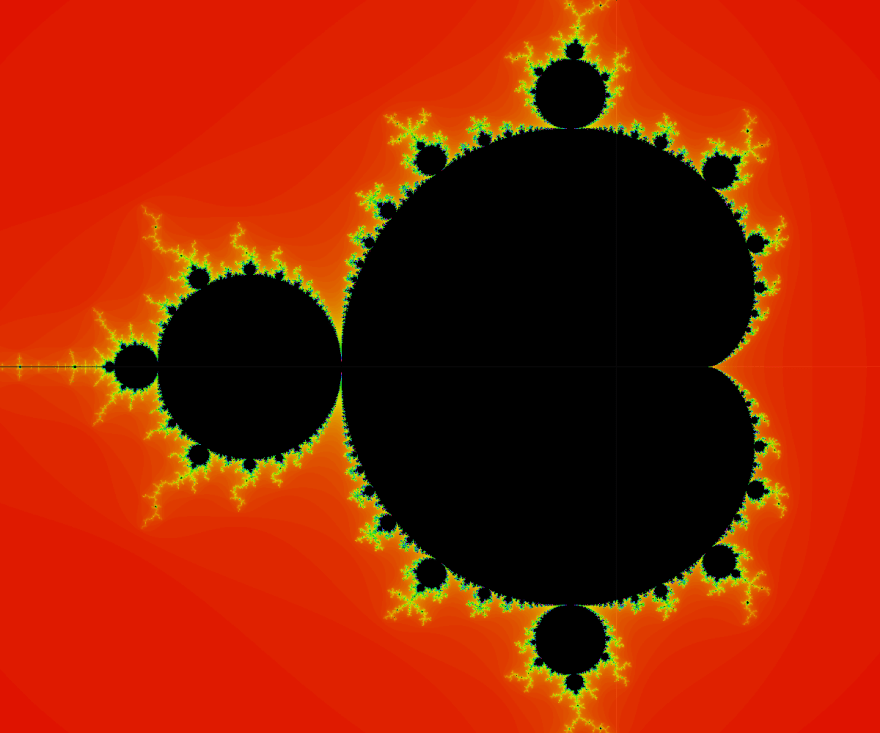
This looks closer to what I see in most online visualisations. Here I'm using the same iterations-till-blowup value and then mapping that to a hue (think HSL).
Now I'll leave you with the 12K x 10K resolution version of this image. I won't render it on this page directly because that would tank its load time. You can click on this link to view it. If you compare it to the low res ones you should see a significantly greater amount of detail visible.
A More Sensible Approach
I wanted to see the tiniest details in the fractal pattern and I thought the way to go about doing that would be to create a very high resolution image. But there's only so much a tiny computer can do. And once you cross the screen resolutions currently available (4K is only 3840 x 2160, compared to the 12K x 10K image I generated which can never be fully represented on a 4K screen), you'll have to zoom in a lot to see details. There is a never a time when you can see the full fractal in absolute detail.
Then there's the matter of how long it takes to generate one of these. If you want to play around with iteration values or colors or any other paramter, you would have to generate the static image all over again. Not fun.
I decided to watch some more YouTube videos and figure out how to do this better. I turned to Daniel Shiffman, one of the best YouTube educators I know of in the programming space.
A new plan formed in my mind.
Zooming and Panning
I fired up the p5 editor again. Since I was planning to keep the resolution fairly small, I figured I could keep things in the browser. Or rather, because I wanted to keep it in the browser, I decided to go with the low, low resolution of 400 x 400.
I also made it so the image can be zoomed using + and - and panned using the arrow keys. It still happens really slowly, but at least it works.
Note: In case the embed is not working, go here.
I decided to get a little bit fancy and let the image appear iteration by iteration all the way up to 200. The iterations here are the maximum number of iterations at which we stop testing if the z value will grow beyond 2 (blow up). As you can see, the more iterations performed, the more detailed the picture. This effect is clearer when you are zoomed into one of the edges. You can see the details becoming finer.
Zooming and panning is the way to go forward. If you are to look at only a part of the image at a time, why bother rendering the rest? Graphics programmers have known this since ages beyond reckoning. It took me a failed attempt at generating a high res image at speed to think of doing the same thing (and ideas from Shiffman's video).
Making It Smoother
This rendering is still very clunky, and quite slow. Even at smaller iterations. I want at least 200 iterations to get good fractal detail which will make this run really slowly. But Javascript is single-threaded and there isn't any more I can squeeze out of it. Or can I?
Web Workers have been a thing for a while. OffScreen Canvases are somewhat newer (and not very well supported on non-Chrome browsers). The demo I present here might not work if you're not on the latest Chrome and I apologise for that. Making it work in other ways is possible but too tedious and not something I want to do.
I've since learned that a Uint8ClampedArray works much better than an OffScreenCanvas both in terms of performance and browser compatibility. It needs more code for computing array indices and colors but overall much better outcome. See the end of the post for details.
Play around with it. ~Click on any part of the image to center it~ Click and drag to pan and use alt/option + up arrow/down arrow or the scroll wheel/pad to zoom in and out. You can zoom in pretty deep before the fractal finally gives up; numbers on a computer only have so much precision.
The entire code for it (which is small), can be found here: https://github.com/BadgerBadgerBadgerBadger/smooth-mandelbrot
Let's talk about how it works and why it is so much smoother than the previous version (though not as smooth as I would ultimately like it to be).
Divide and Conquer
Web Workers allow us to run honest-to-goodness OS threads and offload tasks to them. My main goals for my worker threads were:
- Free up the main thread for processing user input.
- Break up the rendering task between multiple workers to speed it up.
We start with the sketch.js as our entry point.
We set up a canvas, attach a click and keyboard listener, and add it to our DOM. We also start the painter.js worker which, as the name suggests, will be doing all the work of painting our canvas. And then we send a setup command to the painter asking it to set everything up and do the first paint.
The interesting bits here are
const offScreen = canvas.transferControlToOffscreen()
and
const message = {
    message: 'setup',
    canvas: offScreen
}
const transfers = [offScreen]
First, we transfer control of our canvas to an offscreen version which we then send to our painter. We are detaching the painting part and the displaying part. Though the canvas is still part of our DOM and displayed as such, the painting is done by the painter in a different thread and the results show up automatically. Also note the function call we make to send the offscreen canvas to our painter worker. That second parameter is an array of Transferrable objects to send to the worker.
Transferrable objects, in short, are those that you can send to a Web Worker and it will be a true memory transfer. The sending thread loses reference to the transferrable (if I try to do anything with offScreen after this bit of code, I will get an error), and the receiving thread assumes full control.
Which is exactly what we want-- we let the painter do the job of painting so our main thread is free to interact with the user. It does so in two ways. A mouse click event and a key type event. I won't go into the code of those. They aren't very interesting or pertinent to this article. Let's just say, they work and they send a draw command to the painter with some parameters.
There is a lot going on here but we need not focus on all of it. Let's look at the interesting bits.
First, the setup. I'm assigning the canvas and its context, retrieved from the setup event sent by the main thread, to the global variables for the painter. Then I start divvying up the tasks. I decided, somewhat arbitrarily, that I want the task of painting to be broken up into 8 parts. I'm sure there is a way to figure out what the optimal number should be, but I just decided to go for 8. So I create 8 acolytes. These acolytes get only a portion of the canvas to work on. I'm slicing up the canvas into 8 vertical slices. We need to know the width of each segment: segmentLength = canvas.width / numOfAcolytes.
Note that I'm not actually slicing up the original canvas. Instead, I'm creating baby canvases, each given to one of the acolytes. Later, once the acolytes have drawn on one of these canvases, we will take the resulting image and paint it onto our main canvas. I hope this analogy of a master painter and their acolytes provides a good analogy for how this process works.
Something I should have talked about much earlier is that the Mandelbrot Set lives somewhere between -3 and 1 on the Complex Line and -2 and 2 on the Real Line. Since the canvas is hundreds of pixels wide and similarly high, we need to map these values from a large range into a smaller one. Which is easy enough to do with a simple map function.
But the acolytes, unless they know exactly by how much each of their canvases are offset from the main canvas, won’t do this computation correctly. Hence, we need to provide them with this info. They also need to know the dimensions of the original canvas so we send that in, too. Furthermore, they need to know what range they need to map their canvases to. So we also pass in the ranges for the x direction and for the y direction.
Most of this info is only sent during setup. We don't change the size of the original canvas or the number of acolytes (and thus the width of each acolyte's segment) during the lifetime of the app. Only the boundaries change when we pan or zoom and we send this information when we issue draw commands.
So let's talk about the draw command, our second case in the switch-case. When receiving a draw command, the painter could receive mouse or keyboard events from the main thread. We allow users to pan the canvas by clicking on a point in the image and we pan so that that point becomes the new center of the image. The if (mousePos.x !== undefined) { block of the if statement takes care of this. I won't explain the math here. Suffice it to say, that based on the position of the mouse click, we adjust the boundaries. Similarly, in the } else if (zoomBy) { block, we adjust the boundaries so we are zooming in/out of the image.
Either way, once the new boundaries are computed, the global xBounds and yBounds variables are updated and the draw function of the painter is called. This is a really simple function that sends the boundaries and number of iterations to the acolytes and asks them to paint their pieces of the canvas. The acolytes do that (we'll talk about that next), and send these images back which we capture in the onAcolyteMessage function. We know which acolyte sent the image, hence we know which piece of the canvas they were given and we paint the image onto the canvas at that place.
Note, I am not waiting to collect all the responses from each acolyte for each draw command before updating the canvas. That would probably lead to smoother looking updates. Right now, if you pan or zoom quickly you can see the update happening in bands as each acolyte draws their portion of the image.
The code for the acolytes is quite simple as well. In the setup command we capture the canvas and context for drawing and we capture the boundaries. And then it draws once. Further, when it receives more draw commands, it updates its knowledge of the boundaries and draws its part of the image again.
The draw function itself isn't very different from what I've done in previous versions of the generator. Iterate over the pixels, map it into the correct range, figure out if it is part of the set or not and color accordingly. It then gets a copy of the image from its canvas and sends that to the painter (again via Transferrable). It seems while a normal canvas can have its drawing part detached and in a different thread with updates to the drawing appearing on the canvas, the same is not true if you use an OffscreenCanvas instance. This is still an experimental API so it will be really interesting to see how it develops.
Note: You might have noticed that the acolytes are receiving
maxItersas well. Currently they aren't doing anything interesting with this variable. I've set it to a fixed value and it stays there. I could potentially play with it but I don't want to.
And that's mostly it. I have a main thread which kicks everything off and then handles user input and sends to the painter. The painter decides the image boundaries based on user input (panning/zooming), and then offloads the drawing of sections of the canvas to the acolytes.
Hope you enjoyed the post. Feedback is appreciated.
Updates
@lovasoa was kind enough to contribute several optimisation updates that make smooth mandelbrot worth its name. These include but are not limited to:
- Using Uint8ClampedArray in the Acolytes for setting color values and passing that back instead of the heavier Canvas objects. Additionally with the non-standard OffScreenCanvas not in use the demo actually works on more browsers.
- Inlining a lot of the Complex math.
- Introducing a mouse-based scroll.
- Flooring numbers using a bitwise OR operator that looks like black magic.
I'd recommend taking a look at his PR to get a feel for the changes.


Top comments (0)