This lab can also be found on GitHub in a slightly easier to read format.
Azure IoT Central and MXChip Hands-on Lab

This hands-on lab is repurposed content from the "Connect an MXChip IoT DevKit device to your Azure IoT Central application" guide.
There are three main sections in this hands-on lab.
Before you begin
To complete the steps in this hands-on lab you need a DevKit device. To purchase a DevKit device, visit MXChip IoT DevKit.
Creating an Azure IoT Central application

As a builder, you use the Azure IoT Central UI to define your Microsoft Azure IoT Central application. This quickstart shows you how to create an Azure IoT Central application that contains a sample device template and simulated devices.
Navigate to the Azure IoT Central Application Manager page. You will need to sign in with a Microsoft personal or work or school account.
To start creating a new Azure IoT Central application, select New Application. This takes you to the Create Application page.

To create a new Azure IoT Central application:
-
Choose the Trail payment plan:
- Trial applications are free for 7 days before they expire. They can be converted to Pay-As-You-Go at any time before they expire.
- Pay-As-You-Go applications are charged per device, with the first 5 devices free.
Learn more about pricing on the Azure IoT Central pricing page.
Choose a friendly application name, such as Contoso IoT. Azure IoT Central generates a unique URL prefix for you. You can change this URL prefix to something more memorable.
Choose the Sample Devkits application template.
Select Create.
Next steps
Take a tour of the Azure IoT Central UI
This article introduces you to the Microsoft Azure IoT Central UI. You can use the UI to create, manage, and use an Azure IoT Central solution and its connected devices.
As a builder, you use the Azure IoT Central UI to define your Azure IoT Central solution. You can use the UI to:
- Define the types of device that connect to your solution.
- Configure the rules and actions for your devices.
- Customize the UI for an operator who uses your solution.
As an operator, you use the Azure IoT Central UI to manage your Azure IoT Central solution. You can use the UI to:
- Monitor your devices.
- Configure your devices.
- Troubleshoot and remediate issues with your devices.
- Provision new devices.
Use the left navigation menu
Use the left navigation menu to access the different areas of the application. You can expand or collapse the navigation bar by selecting < or >:

Search, help, and support
The top menu appears on every page:

- To search for device templates and devices, enter a Search value.
- To change the UI language or theme, choose the Settings icon.
- To sign out of the application, choose the Account icon.
- To get help and support, choose the Help drop-down for a list of resources. In a trial application, the support resources include access to live chat.
You can choose between a light theme or a dark theme for the UI:

Dashboard

The dashboard is the first page you see when you sign in to your Azure IoT Central application. As a builder, you can customize the application dashboard for other users by adding tiles. To learn more, see the Customize the Azure IoT Central operator's view tutorial. Users can also create their own personal dashboards.
Device explorer

The explorer page shows the devices in your Azure IoT Central application grouped by device template.
- A device template defines a type of device that can connect to your application. To learn more, see the Define a new device type in your Azure IoT Central application.
- A device represents either a real or simulated device in your application. To learn more, see the Add a new device to your Azure IoT Central application.
Device sets

The device sets page shows device sets created by the builder. A device set is a collection of related devices. A builder defines a query to identify the devices that are included in a device set. You use device sets when you customize the analytics in your application. To learn more, see the Use device sets in your Azure IoT Central application article.
Analytics

The analytics page shows charts that help you understand how the devices connected to your application are behaving. An operator uses this page to monitor and investigate issues with connected devices. The builder can define the charts shown on this page. To learn more, see the Create custom analytics for your Azure IoT Central application article.
Jobs

The jobs page allows you to perform bulk device management operations onto your devices. The builder uses this page to update device properties, settings, and commands. To learn more, see the Run a job article.
Device Templates

The device templates page is where a builder creates and manages the device templates in the application. To learn more, see the Define a new device type in your Azure IoT Central application tutorial.
Continuous Data Export

The continuous data export page is where an administrator defines how to export data, such as telemetry, from the application. Other services can store the exported data or use it for analysis. To learn more, see the Export your data in Azure IoT Central article.
Administration

The administration page contains links to the tools an administrator uses such as defining users and roles in the application. To learn more, see the Administer your Azure IoT Central application article.
Next steps
Connecting an MXChip IoT DevKit device to your Azure IoT Central application
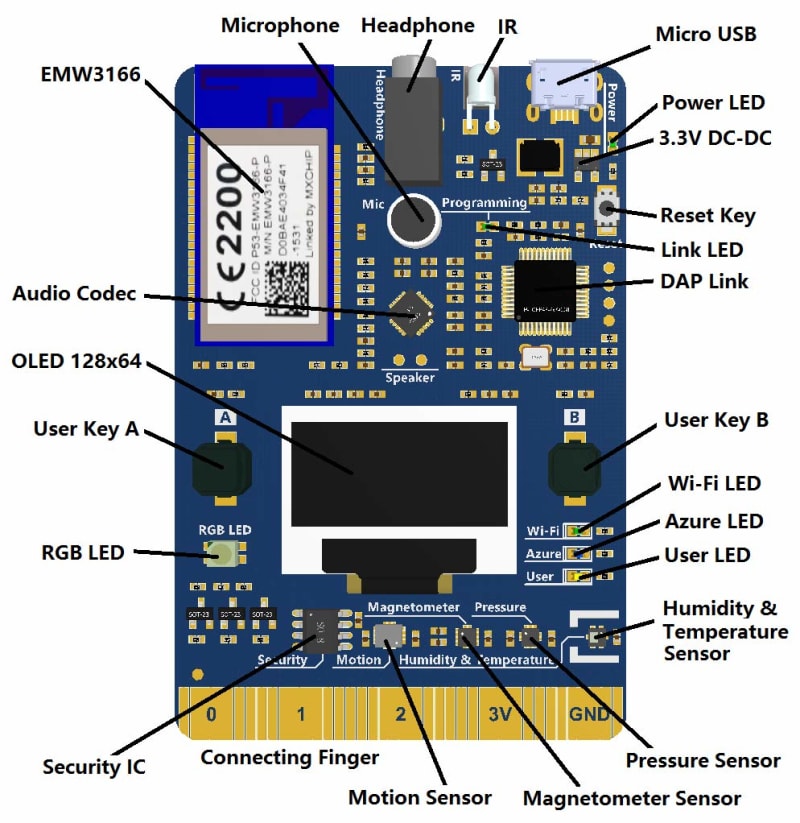
This article describes how, as a device developer, to connect a MXChip IoT DevKit (DevKit) device to your Microsoft Azure IoT Central application.
Sample Devkits application
An application created from the Sample Devkits application template includes a MXChip device template that defines the following device characteristics:
- Telemetry measurements for Humidity, Temperature, Pressure, Magnetometer (measured along X, Y, Z axis), Accelerometer (measured along X, Y, Z axis), and Gyroscope (measured along X, Y, Z axis).
- State measurement for Device State.
- Event measurement for Button B Pressed.
- Settings for Voltage, Current, Fan Speed, and an IR toggle.
- Device properties die number and Device Location, which is a location property.
- Cloud property Manufactured In.
- Commands Echo and Countdown. When a real device receives an Echo command, it shows the sent value on the device's display. When a real device receives a Countdown command, the LED cycles through a pattern, and the device sends countdown values back to IoT Central.
For full details about the configuration, see MXChip Device template details
Add a real device
Get your device connection details
In your Azure IoT Central application, add a real device from the MXChip device template and make a note of the device connection details: Scope ID, Device ID, and Primary key:
- Add a real device from Device Explorer, select +New > Real to add a real device.
- Enter a lowercase Device ID, or use the suggested Device ID.
-
Enter a Device Name, or use the suggested name

-
To get the device connection details, Scope ID, Device ID, and Primary key, select Connect on the device page.

Make a note of the connection details. You're temporarily disconnected from the internet when you prepare your DevKit device in the next step.
Prepare the DevKit device
If you've previously used the device and want to reconfigure it to use a different WiFi network, connection string, or telemetry measurement, press both the A and B buttons at the same time. If it doesn't work, press Reset button and try again.
To prepare the DevKit device
- Download the latest pre-built Azure IoT Central firmware for the MXChip from the releases page on GitHub.
- Connect the DevKit device to your development machine using a USB cable. In Windows, a file explorer window opens on a drive mapped to the storage on the DevKit device. For example, the drive might be called AZ3166 (D:).
Drag the iotCentral.bin file onto the drive window. When the copying is complete, the device reboots with the new firmware.
When the DevKit device restarts, the following screen displays:
    Connect HotSpot:
    AZ3166_??????
    go-> 192.168.0.1
    PIN CODE xxxxx
If the screen displays anything else, reset the device and press the A and B buttons on the device at the same time to reboot the device.
The device is now in access point (AP) mode. You can connect to this WiFi access point from your computer or mobile device.
On your computer, phone, or tablet connect to the WiFi network name shown on the screen of the device. When you connect to this network, you don't have internet access. This state is expected, and you're only connected to this network for a short time while you configure the device.
-
Open your web browser and navigate to http://192.168.0.1/start. The following web page displays:

On the web page, enter:
- The name of your WiFi network
- Your WiFi network password
- The PIN code shown on the device's display
- The connection details Scope ID, Device ID, and Primary key of your device (you should have already saved this following the steps)
- Select all the available telemetry measurements
-
After you choose Configure Device, you see this page:

Press the Reset button on your device.
View the telemetry
When the DevKit device restarts, the screen on the device shows:
- The number of telemetry messages sent.
- The number of failures.
- The number of desired properties received and the number of reported properties sent.
If the device appears to loop when it tries to connect, check if the device is Blocked in IoT Central, and Unblock the device so it can connect to the app.
Shake the device to send a reported property. The device sends a random number as the Die number device property.
You can view the telemetry measurements and reported property values, and configure settings in Azure IoT Central:
-
Use Device Explorer to navigate to the Measurements page for the real MXChip device you added:

-
On the Measurements page, you can see the telemetry coming from the MXChip device:

-
On the Properties page, you can view the last die number and the device location reported by the device:

-
On the Settings page, you can update the settings on the MXChip device:

-
On the Commands page, you can call the Echo and Countdown commands:

-
On the Dashboard page, you can see the location map

MXChip Development with Visual Studio Code (Advanced)

If you want to explore and modify the device code, you can download it from GitHub. If you plan to modify the code, you should follow these instructions to prepare the development environment for your desktop operating system.
To download the source code, run the following command on your desktop machine:
git clone https://github.com/Azure/iot-central-firmware
The previous command downloads the source code to a folder called iot-central-firmware.
If git is not installed in your development environment, you can download it from https://git-scm.com/download.
Review the code
Use Visual Studio Code to open the MXCHIP/mxchip_advanced folder in the iot-central-firmware folder:

To see how the telemetry is sent to the Azure IoT Central application, open the telemetry.cpp file in the src folder:
The function
TelemetryController::buildTelemetryPayloadcreates the JSON telemetry payload using data from the sensors on the device.The function
TelemetryController::sendTelemetryPayloadcallssendTelemetryin the AzureIOTClient.cpp to send the JSON payload to the IoT Hub your Azure IoT Central application uses.
To see how property values are reported to the Azure IoT Central application, open the telemetry.cpp file in the src folder:
The function
TelemetryController::loopsends the location reported property approximately every 30 seconds. It uses thesendReportedPropertyfunction in the AzureIOTClient.cpp source file.The function
TelemetryController::loopsends the dieNumber reported property when the device accelerometer detects a double tap. It uses thesendReportedPropertyfunction in the AzureIOTClient.cpp source file.
To see how the device responds to commands called from the IoT Central application, open the registeredMethodHandlers.cpp file in the src folder:
The dmEcho function is the handler for the echo command. It shows the displayedValue filed in the payload on the device's screen.
The dmCountdown function is the handler for the countdown command. It changes the color of the device's LED and uses a reported property to send the countdown value back to the IoT Central application. The reported property has the same name as the command. The function uses the
sendReportedPropertyfunction in the AzureIOTClient.cpp source file.
The code in the AzureIOTClient.cpp source file uses functions from the Microsoft Azure IoT SDKs and libraries for C to interact with IoT Hub.
For information about how to modify, build, and upload the sample code to your device, see the readme.md file in the MXCHIP/mxchip_advanced folder.
MXChip Device template details
An application created from the Sample Devkits application template includes a MXChip device template with the following characteristics:
Measurements
Telemetry
| Field name | Units | Minimum | Maximum | Decimal places |
|---|---|---|---|---|
| humidity | % | 0 | 100 | 0 |
| temp | °C | -40 | 120 | 0 |
| pressure | hPa | 260 | 1260 | 0 |
| magnetometerX | mgauss | -1000 | 1000 | 0 |
| magnetometerY | mgauss | -1000 | 1000 | 0 |
| magnetometerZ | mgauss | -1000 | 1000 | 0 |
| accelerometerX | mg | -2000 | 2000 | 0 |
| accelerometerY | mg | -2000 | 2000 | 0 |
| accelerometerZ | mg | -2000 | 2000 | 0 |
| gyroscopeX | mdps | -2000 | 2000 | 0 |
| gyroscopeY | mdps | -2000 | 2000 | 0 |
| gyroscopeZ | mdps | -2000 | 2000 | 0 |
States
| Name | Display name | NORMAL | CAUTION | DANGER |
|---|---|---|---|---|
| DeviceState | Device State | Green | Orange | Red |
Events
| Name | Display name |
|---|---|
| ButtonBPressed | Button B Pressed |
Settings
Numeric settings
| Display name | Field name | Units | Decimal places | Minimum | Maximum | Initial |
|---|---|---|---|---|---|---|
| Voltage | setVoltage | Volts | 0 | 0 | 240 | 0 |
| Current | setCurrent | Amps | 0 | 0 | 100 | 0 |
| Fan Speed | fanSpeed | RPM | 0 | 0 | 1000 | 0 |
Toggle settings
| Display name | Field name | On text | Off text | Initial |
|---|---|---|---|---|
| IR | activateIR | ON | OFF | Off |
Properties
| Type | Display name | Field name | Data type |
|---|---|---|---|
| Device property | Die number | dieNumber | number |
| Device property | Device Location | location | location |
| Text | Manufactured In | manufacturedIn | N/A |
Commands
| Display name | Field name | Return type | Input field display name | Input field name | Input field type |
|---|---|---|---|---|---|
| Echo | echo | text | value to display | displayedValue | text |
| Countdown | countdown | number | Count from | countFrom | number |
Next steps
Setting up a device template
A device template is a blueprint that defines the characteristics and behaviors of a type of device that connects to an Azure IoT Central application.
For example, a builder can create a device template for an IoT-connected fan that has a:
Temperature telemetry measurement
Fan motor error event measurement
Fan operating state measurement
Fan speed setting
Location property
Rules that send alerts
Dashboard that gives you an overall view of the device
From this device template, an operator can create and connect real fan devices with names such as fan-1 and fan-2. All these fans have measurements, settings, properties, rules, and a dashboard that users of your application can monitor and manage.
Only builders and administrators can create, edit, and delete device templates. Any user can create devices on the Device Explorer page from existing device templates.
Create a device template
Navigate to the Device Templates page.
To create a template, start by selecting +New.
To get started quickly, choose from the existing pre-built templates. Otherwise, select Custom, enter a name, and click Create to build your own template from scratch.

- When you create a custom template, you see the Device Details page for your new device template. IoT Central automatically creates a simulated device when you create a device template. A simulated device lets you test the behavior of your application before you connect a real device.
The following sections describe each of the tabs on the Device Template page.
Measurements
Measurements are the data that comes from your device. You can add multiple measurements to your device template to match the capabilities of your device.
- Telemetry measurements are the numerical data points that your device collects over time. They're represented as a continuous stream. An example is temperature.
- Event measurements are point-in-time data that represents something of significance on the device. A severity level represents the importance of an event. An example is a fan motor error.
- State measurements represent the state of the device or its components over a period of time. For example, a fan mode can be defined as having Operating and Stopped as the two possible states.
Create a telemetry measurement
To add a new telemetry measurement, select + New Measurement, choose Telemetry as the measurement type, and enter the details on the form.
The field names in the device template must match the property names in the corresponding device code in order for the telemetry measurement to be displayed in the application when a real device is connected. Do the same when you configure settings, device properties, and commands as you continue to define the device template in the following sections.
For example, you can add a new temperature telemetry measurement:
| Display Name | Field Name | Units | Min | Max |
|---|---|---|---|---|
| Temperature | temp | degC | 0 | 100 |

After you select Save, the Temperature measurement appears in the list of measurements. In a short while, you see the visualization of the temperature data from the simulated device.
When displaying telemetry, you can choose from the following aggregation options: Average, Minimum, Maximum, Sum, and Count. Average is selected as the default aggregation on the chart.
The data type of the telemetry measurement is a floating point number.
Create an event measurement
To add a new event measurement, select + New Measurement and select Event as the measurement type. Enter the details on the Create Event form.
Provide the Display Name, Field Name, and Severity details for the event. You can choose from the three available levels of severity: Error, Warning, and Information.
For example, you can add a new Fan Motor Error event.
| Display Name | Field Name | Default Severity |
|---|---|---|
| Fan Motor Error | fanmotorerror | Error |

After you select Save, the Fan Motor Error measurement appears in the list of measurements. In a short while, you see the visualization of the event data from the simulated device.
To view more details about an event, select the event icon on the chart:

The data type of the event measurement is string.
Create a state measurement
To add a new state measurement, select the + New Measurement button and select State as the measurement type. Enter the details on the Create State form.
Provide the details for Display Name, Field Name, and Values of the state. Each value can also have a display name that will be used when the value appears in charts and tables.
For example, you can add a new Fan Mode state that has two possible values that the device can send, Operating and Stopped.
| Display Name | Field Name | Value 1 | Display Name | Value 2 | Display Name |
|---|---|---|---|---|---|
| Fan Mode | fanmode | 1 | Operating | 0 | Stopped |

After you select Save, the Fan Mode state measurement appears in the list of measurements. In a short while, you see the visualization of the state data from the simulated device.
If the device sends too many data points in a small duration, the state measurement appears with a different visual. Select the chart to view all the data points within that time period in chronological order. You can also narrow down the time range to see the measurement plotted on the chart.
The data type of the state measurement is string.
Settings
Settings control a device. They enable operators to provide inputs to the device. You can add multiple settings to your device template that appear as tiles on the Settings tab for operators to use. You can add many types of settings: number, text, date, toggle, pick list, and section label.
Settings can be in one of three states. The device reports these states.
Synced: The device has changed to reflect the setting value.
Pending: The device is currently changing to the setting value.
Error: The device has returned an error.
For example, you can add a new fan speed setting by selecting Settings and entering in the new Number setting:
| Display Name | Field Name | Units | Decimals | Initial |
|---|---|---|---|---|
| Fan Speed | fanSpeed | RPM | 2 | 0 |

After you select Save, the Fan Speed setting appears as a tile. An operator can use the setting on the Device Explorer page to change the fan speed of the device.
Properties
Properties are metadata that's associated with the device, such as device location and serial number. Add multiple properties to your device template that appear as tiles on the Properties tab. A property can have a type such as number, text, date, toggle, device property, label, or location. An operator can specify the values for properties when they create a device, and they can edit these values at any time. Device properties are read-only and are sent from the device to the application. An operator cannot change device properties. When a real device connects, the device property tile is updates in the application.
There are two categories of properties:
- Device properties that the device reports to the IoT Central application. Device properties are read-only values reported by the device and are updated in the application when a real device is connected.
- Application properties that are stored in the application and can be edited by the operator. The device doesn't recognize application properties.
For example, you can add the last serviced date for the device as a new Date property (an application property) on the Properties tab:
| Display Name | Field Name | Initial Value |
|---|---|---|
| Last serviced | lastServiced | 01/29/2019 |

After you select Save, the last serviced date for the device appears as a tile.
After you create the tile, you can change the application property value in the Device Explorer.
Create a location property through Azure Maps
You can give geographic context to your location data in Azure IoT Central and map any latitude and longitude coordinates of a street address. Or you can map latitude and longitude coordinates. Azure Maps enables this capability in IoT Central.
You can add two types of location properties:
- Location as an application property, which is stored in the application. The device doesn't recognize application properties.
- Location as a device property, which the device reports to the application.
Add location as an application property

You can create a location property as an application property by using Azure Maps in your IoT Central application. For example, you can add the device installation address:
Navigate to the Properties tab.
In the library, select Location.
-
Configure Display Name, Field Name, and (optionally) Initial Value for the location.
Display Name Field Name Initial Value Installation address installAddress Microsoft, 1 Microsoft Way, Redmond, WA 98052

There are two supported formats to add a location:
- Location as an address
- Location as coordinates
- Select Save. An operator can update the location value in the Device Explorer.
Add location as a device property
You can create a location property as a device property that the device reports. For example, if you want to track the device location:
Navigate to the Properties tab.
Select Device Property from the library.
-
Configure the display name and field name, and select Location as the data type:
Display Name Field Name Data Type Device location deviceLocation location
The field names must match the property names in the corresponding device code

Once the real device is connected, the location that you added as a device property is updated with the value sent by the device. Now that you've configured your location property, you can add a map to visualize the location in the device dashboard.
Commands
Commands are used to remotely manage a device. They enable operators to run commands on the device. You can add multiple commands to your device template that appear as tiles on the Commands tab for operators to use. As the builder of the device, you have the flexibility to define commands according to your requirements.
How is a command different from a setting?
Setting: A setting is a configuration that you want to apply to a device. You want the device to persist that configuration until you change it. For example, you want to set the temperature of your freezer, and you want that setting even when the freezer restarts.
Command: You use commands to instantly run a command on the device remotely from IoT Central. If a device isn't connected, the command times out and fails. For example, you want to restart a device.
For example, you can add a new Echo command by selecting the Commands tab, then selecting + New Command, and entering the new command details:
| Display Name | Field Name | Default Timeout | Data Type |
|---|---|---|---|
| Echo Command | echo | 30 | text |

After you select Save, the Echo command appears as a tile and is ready to be used from the Device Explorer when your real device connects. The field names of your command must match the property names in the corresponding device code in order for commands to be run successfully.
Rules
Rules enable operators to monitor devices in near real time. Rules automatically invoke actions such as sending an email when the rule is triggered. One type of rule is available today:
- Telemetry rule, which is triggered when the selected device telemetry crosses a specified threshold. Learn more about telemetry rules.
Dashboard
The dashboard is where an operator can go to see information about a device. As a builder, you can add tiles on this page to help operators understand how the device is behaving. You can add multiple dashboard tiles to your device template. You can add many types of dashboard tiles such as image, line chart, bar chart, key performance indicator (KPI), settings and properties, and label.
For example, you can add a Settings and Properties tile to show a selection of the current values of settings and properties by selecting the Dashboard tab and the tile from the Library:

Now when an operator views the dashboard in the Device Explorer, they can see the tile.
Add an Azure Maps location in the dashboard
If you configured a location property, you can visualize the location by using a map in your device dashboard.
Navigate to the Dashboard tab.
On the device dashboard, select Map from the library.
Give the map a title. The following example has the title Installation Location. Then choose the location property that you previously configured on the Properties tab. In the following example, Installation address is selected.

- Select Save. The map tile now displays the location that you selected.
You can resize the map to your desired size. Now when an operator views the dashboard in the Device Explorer, all the dashboard tiles that you've configured, including a location map are visible.


Top comments (1)
I don't get Chart for Temperature. Actually missing charts for many sensors only Pressure and Humidity is displaying.
When i look at raw data it is going under unmodelled data. How do i display them in chart?