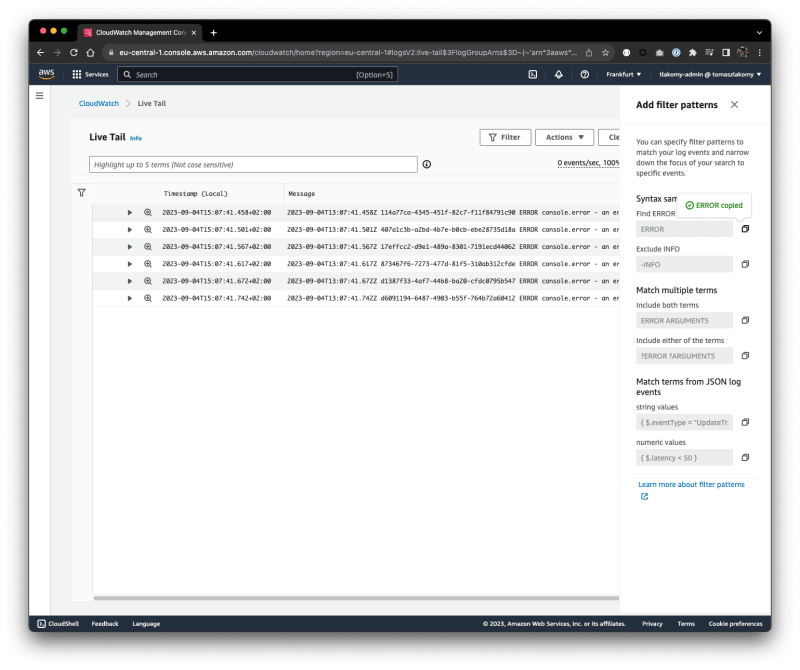
AWS has recently introduced a new feature for real-time log analytics: CloudWatch Logs Live Tail.
You can now view your logs interactively in real-time as they’re ingested, which helps you to analyze and resolve issues across your systems and applications.
To access this feature, log in to your AWS account, choose Logs->Live tail, select log groups of interest (up to 10), apply filters as needed and you're good to go.
Sample filters source:
-
error 404displays only log events that include both error and 404 -
?Error ?errordisplays log events that include either Error or error -
-INFOdisplays all log events that don't include INFO -
{ $.eventType = "UpdateTrail" }displays all JSON log events where the value of the event type field is UpdateTrail
Feature overview, as described by AWS:
- Real-Time Viewing: See logs interactively as they're ingested. No more waiting.
- Rich User Experience: Easily view and detect issues in incoming logs.
- Granular Controls: Filter, highlight, pause, and replay logs on-the-go.
- Quick Validation: Ideal for DevOps teams, validate processes, configuration changes, and deployment success in real time.
Once you get tired of watching your logs fly in real time, you can either copy or download the logs for further analysis as CSV, JSON or XLSX (for hard core Excel fans out there).
All logs can be filtered based on log group, log stream and custom filter patterns. For instance you can find all ERROR logs in a given log group.
Summary:
Overall I think this is a great addition to the CloudWatch Logs ecosystem. It's a simple feature that can save you a lot of time when debugging issues in your application. Not that I ever have a production outage 😎, but if I did, I'd definitely use this feature to help me resolve it. The only weird bit is the N events/sec screen, in my testing it was not entirely accurate, but then again - my sample UserService is not exactly a production-grade application.


Top comments (0)