“ERROR: could not write block n of temporary file: No space left on device.”
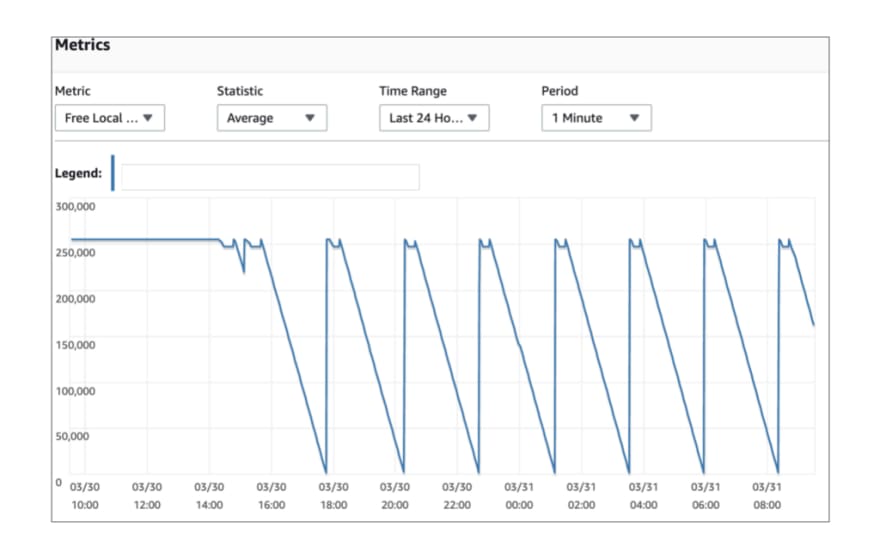
Sounds familiar? “No space left on device” is certainly not common when it comes to Amazon Aurora as storage scales automatically up to 128TB and you’re less likely to reach the limit when you scale up your application on a single Amazon Aurora database cluster. No need to delete data or to split the database across multiple instances for storage purposes which is great. What’s going on with Local Storage then? We could be still be left with low local storage or no space leading to failover if we are running databases that are generally used for OLTP but has the need to periodically run fewer but large jobs that push the local storage limits.
This post attempts to shed some more light on Amazon Aurora, the Local Storage architecture as well as some options to improve performance and utilize local storage, lower IO costs as well as not run into local storage limits. For simplicity, I will be focusing on Amazon Aurora for PostgreSQL for engine-specific examples and references on architecture for storage, memory, and optimizations.
Amazon Aurora Storage Architecture and IO
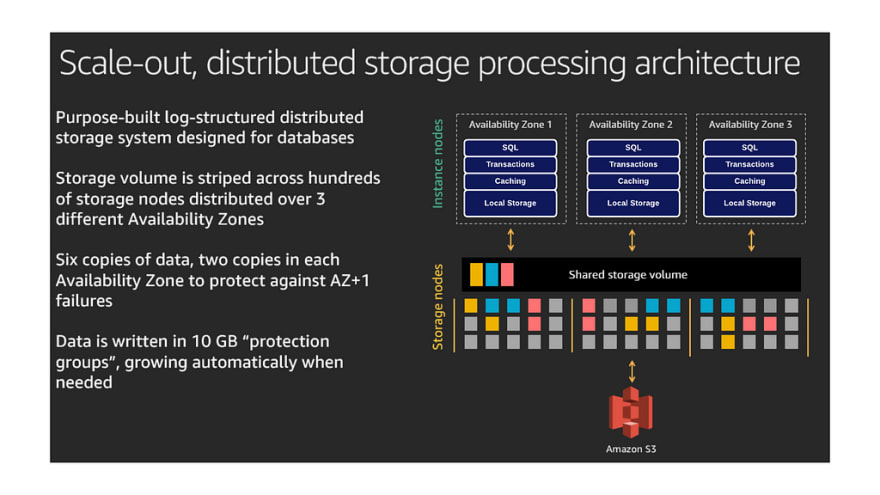
Amazon Aurora is backed by a robust, scalable, and distributed storage architecture. One of the big advantages of Amazon Aurora has been elastic storage that scales with your data eliminating the need for provisioning large storage capacity and utilize some percentage of that. For a while when you deleted data from Aurora clusters, such as by dropping a table or partition, the overall allocated storage space remained the same. Since October 2020, the storage space allocated to your Amazon Aurora database cluster decreases dynamically when you delete data from the cluster. The storage space already automatically increases up to a maximum size of 128 tebibytes (TiB), and will now automatically decrease when data is deleted. Please refer to Dynamic Resizing of Database Storage Space for more details.
Storage Types
Amazon Aurora clusters have two types of storage:
- Storage used for persistent data (shared cluster storage). For more information, see What the cluster volume contains.
- Storage used for temporary data and logs (local storage). All DB files (for example, error logs, temporary files, and temporary tables) are stored in the DB instance local storage. This includes sorting operations, hash tables, grouping operations that SQL queries require, storage that the error logs occupy, and temporary tables that form. Simply put, the Temp space uses the local “ephemeral” volume on the instance.
In general, the components which contribute towards the local storage depend on the engine. For example, on Amazon Aurora for PostgreSQL :
- Any temp tables created by PostgreSQL transactions (includes implicit and explicit user-defined temp tables)
- Data files
- WAL logs
- DB logs
Storage architecture for PostgreSQL on RDS differs from Amazon Aurora where temporary tables use persistent storage as opposed to local instance storage. This could potentially be seen as a big change dependent on the nature of your application and workloads. However, ephemeral storage is faster and cheaper (Amazon Aurora does not charge for IO against local storage) than permanent storage, which makes the queries run faster at less cost.
On the flip side, there is also a vertical limit based on the instance size to what can be processed in memory and on local storage on Amazon Aurora. Each Aurora DB instance contains a limited amount of local storage that is determined by the DB instance class. Typically, the amount of local storage is 2X the amount of RAM for your instance class. An example for db.r5 instance classes:
db.r5.large ~ 31 GiB
db.r5.xlarge ~ 62 GiB
db.r5.2xlarge ~ 124 GiB
db.r5.4xlarge ~ 249 GiB
db.r5.8xlarge ~ 499 GiB
db.r5.12xlarge ~ 748 GiB
db.r5.24xlarge ~ 1500 GiB
In a traditional PostgreSQL installation, one could overcome this limitation by creating tablespaces and configuring this to the appropriate storage volume. Aurora PostgreSQL doesn’t have a filesystem for its tablespace. It has a block store and does not allow using the primary data volume that is elastic. While tablespaces are still allowed to be created on Amazon Aurora (and could configure temp_tablespaces) it is mostly there for compatibility.
This is a huge shortcoming in terms of the storage architecture, which could have Amazon Aurora users needing to upgrade the instance class just for this purpose leading to additional costs (Note: IO against local storage is not charged) and left with unused capacity. The preferred solution is to optimize our workloads and database configuration to minimize or completely avoid spillover to disk along with having multiple instances in the cluster for failover in the event where you run low on local disk space.
I hope local instance storage on Amazon Aurora be considered for auto-scaling and/or be made configurable in the future!
IO
As folks migrate to Amazon Aurora it is really useful to understand the IO subsystem from a performance as well as a cost perspective.
I/Os are input/output operations performed by the Aurora database engine against its SSD-based virtualized storage layer. Every database page read operation counts as one I/O. The Aurora database engine issues reads against the storage layer in order to fetch database pages not present in memory in the cache. If your query traffic can be totally served from memory or the cache, you will not be charged for retrieving any data pages from memory. If your query traffic cannot be served entirely from memory, you will be charged for any data pages that need to be retrieved from storage. Each database page is 8KB in Aurora PostgreSQL.
Amazon Aurora was designed to eliminate unnecessary I/O operations in order to reduce costs and to ensure resources are available for serving read/write traffic. Write I/Os are only consumed when persisting write-ahead log records in Aurora PostgreSQL to the storage layer for the purpose of making writes durable. Write I/Os are counted in 4KB units. For example, a log record that is 1024 bytes will count as one write I/O operation. However, if the log record is larger than 4KB, more than one write I/O operation will be needed to persist it. Concurrent write operations whose log records are less than 4KB may be batched together by the Aurora database engine in order to optimize I/O consumption if they are persisted on the same storage protection groups. It is also important to note that, unlike traditional database engines, Aurora never flushes dirty data pages to storage.
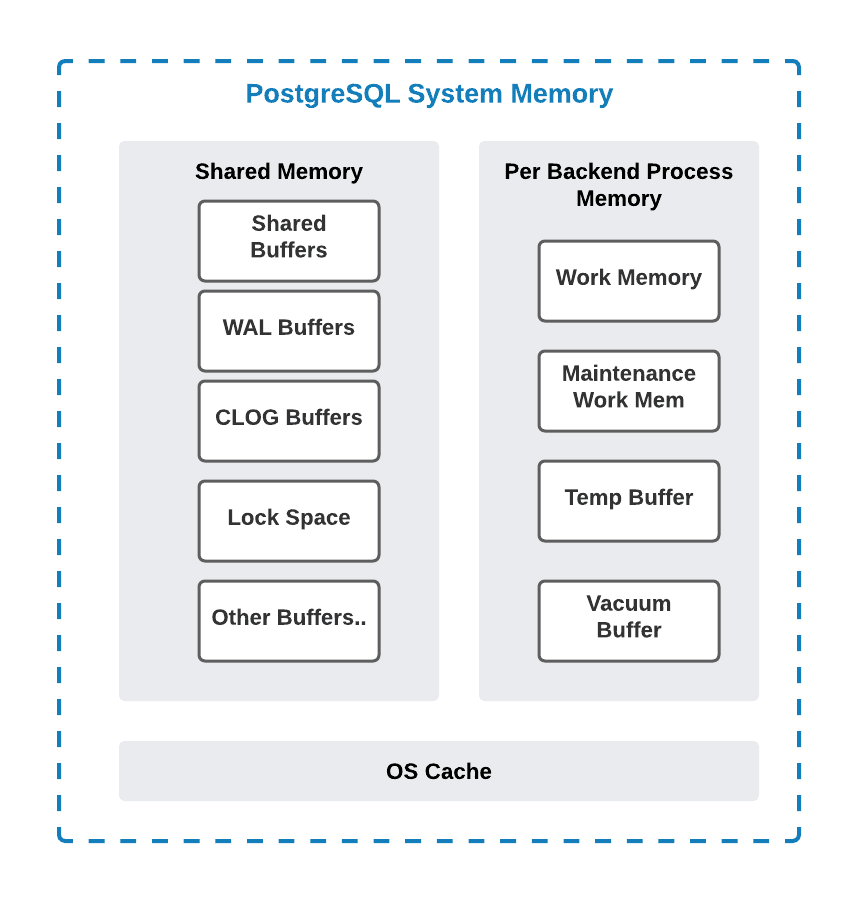
PostgreSQL Memory Architecture
It is important to have a good understanding of the PostgreSQL memory components and architecture as we work through SQL optimizations related to performance and IO. Let us take a look at the big pieces next!
Work_Mem
Probably the most important of all of the buffers in PostgreSQL and requires to be tuned in most cases when it comes to reducing IO or improving query performance. The work_mem value defaults to 4MB in PostgreSQL which means that per Postgres activity (each join, some sorts, etc.) can consume 4MB before it starts overflowing to disk. Honestly, that’s a bit low for many modern use-cases. When Postgres starts writing temp files to disk, obviously things will be much slower than in memory. One size does not fit all and it’s always tough to get the right value for work_mem perfect. A lot depends on your workloads such as fewer connections with large queries (good to tune), or a lot of connections with a lot of smaller queries (defaults will work), or a combination of both (probably a combination of tuning and/or defaults with session overrides). Often a sane default (> PostgreSQL defaults) can be figured out with appropriate testing and effective monitoring.
Note that starting PostgreSQL 10 parallel execution is enabled and could make a significant difference in query processing and resource utilization. While adjusting work_mem we need to factor in the amount of memory that will be used by your process overall. WORK_MEM limits the memory usage of each process! Not just for queries: work_mem * processes * joins could lead to significant memory usage. A few additional parameters to tune along work_mem are listed below:
- max_parallel_workers_per_gather — no of workers an executor will use for the parallel execution of a planner node
- max_worker_processes — the total number of workers to the number of CPU cores installed on a server
- max_parallel_workers — Sets the maximum number of workers that the system can support for parallel queries.
Maintenance_Work_Mem
Defaults to 64MB and is used by maintenance operations, such as VACUUM, CREATE INDEX, CREATE MATERIALIZED VIEW, and ALTER TABLE ADD FOREIGN KEY. Note that the actual memory used depends on the no of auto vacuum workers (Defaults to 3). For better control of memory available for VACUUM operations, we could configure autovacuum_work_mem which defaults to -1 . (uses maintenance_work_mem when set to defaults)
Temp_Buffer
The default is 8MB assuming a BLCKSZ of 8KB. These are session-local buffers used only for access to temporary tables. Note that this value can only be changed before the first use of temporary tables in the session. Any subsequent attempt will have no effect. For data-heavy queries using temporary tables configuring this to a higher value could lead to performance improvements as well as minimizing overflow to disk.
The temp buffers are only used for access to temporary tables in a user session. There is no relation between temp buffers in memory and the temporary files that are created under the pgsql_tmp directory during large sort and hash table operations.
Shared Buffer
The shared_buffer defines how much dedicated system memory PostgreSQL will use for the cache. There is also a difference compared to PostgreSQL on RDS. This is because Aurora PostgreSQL eliminates double buffering and doesn’t utilize file system cache. As a result, Aurora PostgreSQL can increase shared_buffers to improve performance. It’s a best practice to use the default value of 75% (SUM({DBInstanceClassMemory/12038},-50003)) for the shared_buffers DB parameter when using Aurora PostgreSQL. A smaller value can degrade performance by reducing the available memory to the data pages while also increasing I/O on the Aurora storage subsystem. Tuning the shared buffer may be required in some cases (Such as lowering to 50% of available memory) where we run fewer connections that require a larger work_mem configuration on the session for optimal performance.
WAL Buffer
WAL buffers are used to hold write-ahead log (WAL) records that aren’t yet written to storage. The size of the WAL buffer cache is controlled by the wal_buffers setting. Aurora uses a log-based storage engine and changes are sent to storage nodes for persistence. Given the difference in how writes are handled by the Aurora storage engine, this parameter should be left unchanged (Defaults to 16MB)when using Aurora PostgreSQL.
CLOG Buffers
CLOG (commit log) buffers are an area in operating system RAM dedicated to holding commit log pages. The commit log pages contain a log of transaction metadata and differ from the WAL data. The commit logs have the commit status of all transactions and indicate whether or not a transaction has been completed (committed). There is no specific parameter to control this area of memory. This is automatically managed by the database engine in tiny amounts. This is a shared memory component, which is accessible to all the background server and user processes of a PostgreSQL database.
Memory for Locks / Lock Space
This memory space is used to store all heavyweight locks used by the PostgreSQL instance. These locks are shared across all the background server and user processes connecting to the database. A non-default larger setting of two database parameters namely max_locks_per_transaction (Defaults to 64) and max_pred_locks_per_transaction (Defaults to 64) in a way influences the size of this memory component.
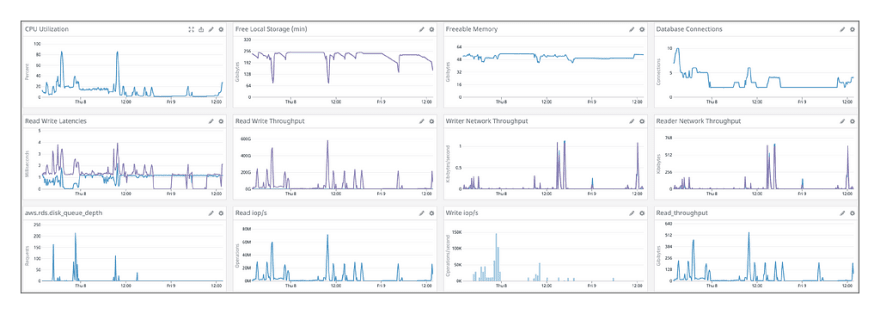
Monitoring Queries and disk usage
This is an interesting space and almost all Aurora engines (Mysql/PostgreSQL etc.) have a rich set of capabilities to monitor and provision adequate memory buffers for optimal processing. I’ll be mostly using PostgreSQL as an example for the rest of my post, which IMHO is a great example of comprehensive in-built monitoring and statistics capabilities.
pg_stat_statements
postgres=> \d pg_stat_statements;
                    View "public.pg_stat_statements"
       Column | Type | Collation | Nullable | Default
--------------------------+------------------+-----------+----------+---------
 userid | oid | | |
 dbid | oid | | |
 queryid | bigint | | |
 query | text | | |
 calls | bigint | | |
 total_time | double precision | | |
 min_time | double precision | | |
 max_time | double precision | | |
 mean_time | double precision | | |
 stddev_time | double precision | | |
 rows | bigint | | |
 shared_blks_hit | bigint | | |
 shared_blks_read | bigint | | |
 shared_blks_dirtied | bigint | | |
 shared_blks_written | bigint | | |
 local_blks_hit | bigint | | |
 local_blks_read | bigint | | |
 local_blks_dirtied | bigint | | |
 local_blks_written | bigint | | |
 temp_blks_read | bigint | | |
 temp_blks_written | bigint | | |
 blk_read_time | double precision | | |
 blk_write_time | double precision | | |
- shared blocks contain data from regular tables and indexes.
- local blocks contain data from temporary tables and indexes.
- temp blocks contain short-term working data used in sorts, hashes, Materialize plan nodes, and similar cases.
The Other tried and tested formula is to enable log_temp_files on your database server which will log any queries that create any temporary file and also their sizes. Sample Log:
2021-04-10 09:30:15 UTC:xx.xx.x.xx(xxxxx):postgres@example:[xxxxx]: **LOG** : 00000: **temporary file** : path "base/pgsql_tmp/pgsql_tmp20362.65", size **1073741824**
2021-04-10 09:30:15 UTC:xx.xx.x.xx(xxxxx):postgres@example:[xxxxx]: **CONTEXT** : SQL statement xxxx
Additionally, we could combine these metrics with native tools for a deep dive on log analysis for your engine such as pgbadger for PostgreSQL.
pg_statio
The pg_statio_ views are primarily useful to determine the effectiveness of the buffer cache. When the number of actual disk reads is much smaller than the number of buffer hits, then the cache is satisfying most read requests without invoking a kernel call. However, these statistics do not give the entire story: due to the way in which PostgreSQL handles disk I/O, data that is not in the PostgreSQL buffer cache might still reside in the kernel's I/O cache, and might therefore still be fetched without requiring a physical read.
Useful Tips
- Enable auto_explain with auto_explain.log_nested_statements = onallows you to see the duration and the execution plans of the SQL statements inside the function in the PostgreSQL log file.
- Enable pg_stat_statements and set the parameter pg_stat_statements.track = all. pg_stat_statements will track information for the SQL statements inside a function. That way you can see metrics at the SQL statement level within your stored procedure or function. In addition, consider configuring pg_stat_statements.max to a higher value than defaults (5000) if you would like to keep a larger dataset to compare. Otherwise, information about the least-executed statements is discarded.
- Track queries and cache hit ratios. It is important to get a good hit ratio such as > 90% in most cases.
- Track top queries and slice by no of executions, execution time avg, CPU, etc. Often CPU-heavy queries are an indicator of a performance problem. It may or may not be a root cause but could be a symptom of an IO-related issue. We can easily get to see these using pg_stat_statements.
- Use pg_statio_all_tables and pg_statio_all_indexes to track IO metrics for tables along with indexes.
- It is a common practice to create temporary tables, insert data and then add an index. However, depending on our data set and key length, we could end up overflowing to disk.
- A longer Log Retention also means more local storage consumption. Workloads and log retention should be adjusted appropriately. Note that Amazon Aurora does compress (gzip) older logs to optimize when storage is low, and will also delete if it's necessary or if storage is critically low. See PostgreSQL database log files for more details on this. For longer periods of retention, consider offloading logs to cloudwatch and/or your choice of monitoring/log analyzer tool.
- Tune conservatively, to begin with, setting shared_buffers and work_mem to some reasonable values based on database size and workload, and setting maintenance_work_mem, effective_cache_size, effective_io_concurrency , temp_buffers and random_page_cost according to your instance size. Note that Amazon Aurora defaults are often based on instance class (memory, CPU, etc). Review carefully and back these configuration updates with a good performance test representative of your data sets and workloads, benchmark results, and iterate.
- Eliminate order by clauses where possible. Sorts against queries spanning several joins and/or large tables are one of the most common bottlenecks for disk overflow that end up creating temporary tables. These are mostly query operations that cannot fit under configured memory buffers such as work_mem, temp_buffers, etc. Please see PostgreSQL Memory Architecture for more details. In many cases, applications can deal with unsorted query results (or just do not care) and can help reduce memory utilization and save us from overflowing to disk on the database.
- Watch out for the Aggregate strategy as well as the sort method on your explain plan surrounding your group by and order by clause. Shown below is an explain plan for a query against a large table with a group by that uses GroupAggregate with external merge disk for its sort method:
**Finalize GroupAggregate** (cost=92782922.93..126232488.05 rows=116059400 width=119) (actual time=2414955.083..2820682.212 rows=59736353 loops=1)
Group Key: t1.id, t1.name, t1.group
-> **Gather Merge** (cost=92782922.93..122750706.05 rows=232118800 width=119) (actual time=2414955.070..2792088.265 rows=108495098 loops=1)
     Workers Planned: 2
     Workers Launched: 2
    -> **Partial GroupAggregate** (cost=92781922.91..95957437.06 rows=116059400 width=119) (actual time=2417780.397..2660540.817 rows=36173064 loops=3)
      Group Key: t1.id, t1.name, t1.group
        -> Sort (cost=92781922.91..93184906.94 rows=161193612 width=119) (actual time=2417780.369..2607915.169 rows=264507496 loops=3)
          Sort Key: t1.id, t1.name, t1.group
          **Sort Method: external merge Disk: 33520120kB**
          **Worker 0: Sort Method: external merge Disk: 33514064kB
 Worker 1: Sort Method: external merge Disk: 33903440kB**
           -> Hash Join (cost=31.67..50973458.94 rows=161193612 width=119) (actual time=123.618..260171.993 rows=264507496 loops=3)
           :::
 Planning Time: 0.413 ms
 **Execution Time: 2977412.203 ms**
Shown below is an explain plan with optimal configuration for work_mem . We can see a huge improvement as this plan usesHashAggregate instead of the GroupAggregate and processes in-memory, thus reduce IO and also improve performance on Amazon Aurora.
**HashAggregate** (cost=79383833.03..80544427.03 rows=116059400 width=119) (actual time=1057250.962..1086043.902 rows=59736353 loops=1)
    Group Key: t1.id, t1.name, t1.group
    -> **Hash Join** (cost=31.67..75515186.35 rows=386864668 width=119) (actual time=272.742..755349.784 rows=793522488 loops=1)
    :::
Planning Time: 0.402 ms
**Execution Time: 1237705.369 ms**
Performance Insights
Amazon Aurora makes many of the key engine-specific metrics available as dashboards. Performance Insights is currently available for Amazon Aurora PostgreSQL compatible Edition, MySQL compatible Edition, PostgreSQL, MySQL, Oracle, SQL Server, and MariaDB.
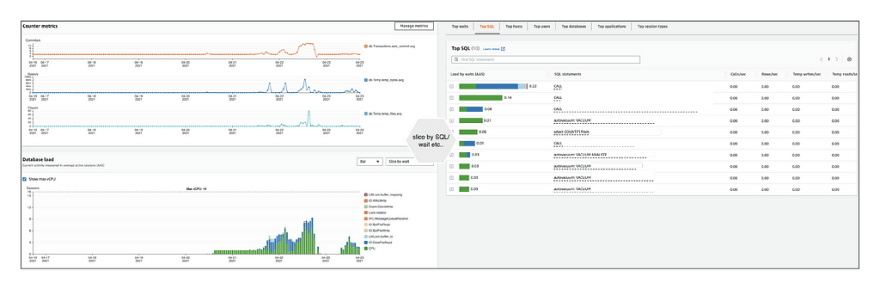
For PostgreSQL stats frompg_stat_statements as well as the active processes and live queries from pg_stat_activity are available on the performance insights dashboard.
Performance Insights can only collect statistics for queries in pg_stat_activity that aren't truncated. By default, PostgreSQL databases truncate queries longer than 1,024 bytes. To increase the query size, change the track_activity_query_size parameter in the DB parameter group associated with your DB instance. When you change this parameter, a DB instance reboot is required.
Testing Query Optimizations and Caching
We always need a good way to test our optimizations and it's quite common that we get different results depending on a test against a cold start vs a test against a warmed up database using cache effectively. This certainly makes it harder to test your optimizations and improvements. However, it is important to note that in runtime you will benefit from caching and should be tested with cache in effect.
There are some good reasons though for testing without cache, and the capabilities to allow that depend on your engine. In Amazon Aurora for Mysql, you could run RESET QUERY CACHE ; between your tests for comparable tests.
In Amazon Aurora for PostgreSQL, we do not deal with any os level cache. I/O is handled by the Aurora storage driver and there is no file system or secondary level of caching for tables or indexes (also another reason to increase your shared_buffer). However, we could use an EXPLAIN (ANALYZE,BUFFERS) to gain insights into your query plan as well as estimate execution times.
postgres=> **EXPLAIN (ANALYZE,BUFFERS) SELECT \* FROM foo;**

QUERY PLAN
------------------------------------------------------------------------ **Seq Scan** on foo ( **cost** =0.00..715.04 **rows** =25004 width=172) (actual time=0.011..3.037 **rows** =25000 **loops** =1)

**Buffers** : shared hit=465
**Planning Time** : 0.038 ms
**Execution Time** : 4.252 ms
We could see how our buffers work for a query and how that translates to caching. For clearing the session cache and the query plan cache, you can use DISCARD PLAN or DISCARD ALL if you want to clear everything. Please see SQL-DISCARD for more information on options.
I hope this post provides you with some insights on Amazon Aurora, the PostgreSQL architecture, challenges with local storage, as well as some useful tips to help you along this journey! Next up, I plan on looking at architecture patterns for transparent read/write splitting on Amazon Aurora as well as benchmarking AWS-provided JDBC driver for PostgreSQL that supports fast failover!
Stay Safe!
Useful References
- Deep Dive on Amazon Aurora with PostgreSQL Compatibility
- Amazon Aurora PostgreSQL Best Practices
- Aurora PostgreSQL Memory and Query Plan Management
- Aurora PostgreSQL benchmarking guide
- Parallel Queries in PostgreSQL
- PostgreSQL Stats Monitoring
Thank you Attila Vágó, Francislâiny Campos, and Andrew Brand for your feedback on this post!

Top comments (0)