This is a copy of an old post on my private blog from April 2022.
I've only recently had my first encounter with Datadog. At Foodist, we decided to monitor our new services with Datadog. That required us to write some shared code used across all microservices. To make the whole implementation more flexible for the future, we opted to implement the OpenTelemetry standard.
This, theoretically, is a trivial task. Instantiate the DD tracer (datadog/dd-trace) and set it as a global tracer with the OpenTracing library (opentracing/opentracing):
require __DIR__ . '/vendor/autoload.php';

$otTracer = new \DDTrace\OpenTracer1\Tracer(\DDTrace\GlobalTracer::get());
\OpenTracing\GlobalTracer::set($otTracer);
The same is true when writing integration tests. You may want to have a function that will create an appropriate tracer for you:
private function createTracer(): \OpenTracing\Tracer
{
    return new \DDTrace\OpenTracer1\Tracer(new \DDTrace\Tracer());
}
And make sure you run your integration tests in separate processes. You might get some residues from the previous tests that interfere with the following tests.
So far, so good. I wrote some tests and simple implementation. The test failed. Not exactly what I expected. But as we all know - xdebug is your best friend when looking for issues in code. The first thing I noticed was that the code stopped before reaching the breakpoints. Because I had PhpStorm configured to stop on the first line if a file is outside of the project, it meant I didn't map some paths properly. Though PhpStorm wasn't very helpful here:
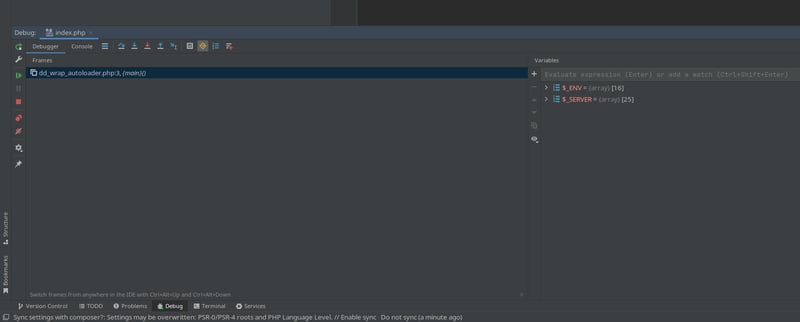
So, the file name is dd_wrap_autoloader.php. I thought it was a path somewhere in datadog/dd-trace library. But no, it's not there. A quick find in the container revealed this:
find / -type f -name "dd_wrap_autoloader.php"
/opt/datadog-php/dd-trace-sources/bridge/dd_wrap_autoloader.php
t turns out that PHP's Datadog extension has some glue code being executed at the beginning of each request. That glue code is in /opt/datadog-php/dd-trace-source/bridge.
So how do we get this mapped inside PhpStorm? Since this path is inside the container, we need to use a named volume to share it with the host. Here is a minimalistic docker-compose.yml I used to depict how it works:
version: '3.7'
services:
  php-cli:
    image: datadog-debugging:latest
    build:
      dockerfile: docker/Dockerfile
      context: .
    volumes:
      - .:/application
      - ./docker/99-ddtrace-custom.ini:/usr/local/etc/php/conf.d/99-ddtrace-custom.ini
      - ./docker/99-xdebug.ini:/usr/local/etc/php/conf.d/99-xdebug.ini
      - datadog_bridge:/opt/datadog-php/dd-trace-sources/bridge

volumes:
  datadog_bridge:
    driver: local
    driver_opts:
      type: 'none'
      o: 'bind'
      device: '/home/alex/Projects/datadog-debugging/var/datadog_bridge'
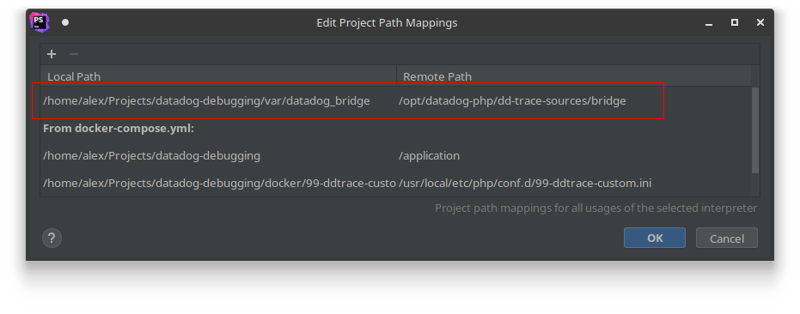
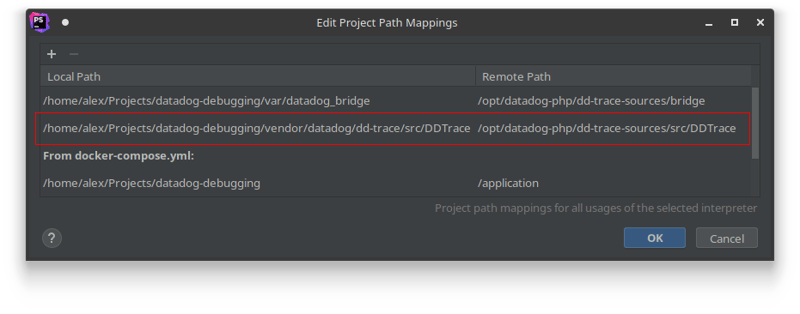
We also have to map the local path to the remote path:
At this point, our breakpoints with our code worked as expected. And it revealed that the tracer that got loaded was a \DDTracer\NoopTracer. TL;DR - I forgot to enable Datadog for CLI. But while figuring it out, I placed a few breakpoints here and there inside the library's code, only to find out the execution had never reached some of them. Even though they theoretically should have. Here are some more findings. If we look into the library's source code, we will find the same namespace (DDTrace) defined a few times.
- src/api/
- src/DDTrace
- /opt/datadog-php/dd-trace-source/bridge/_generated_api.php
- /opt/datadog-php/dd-trace-source/bridge/_generated_integrations.php
- /opt/datadog-php/dd-trace-source/bridge/_generated_tracer.php
- /opt/datadog-php/dd-trace-source/bridge/_generated_tracer_api.php
- /opt/datadog-php/dd-trace-sources/src/DDTrace
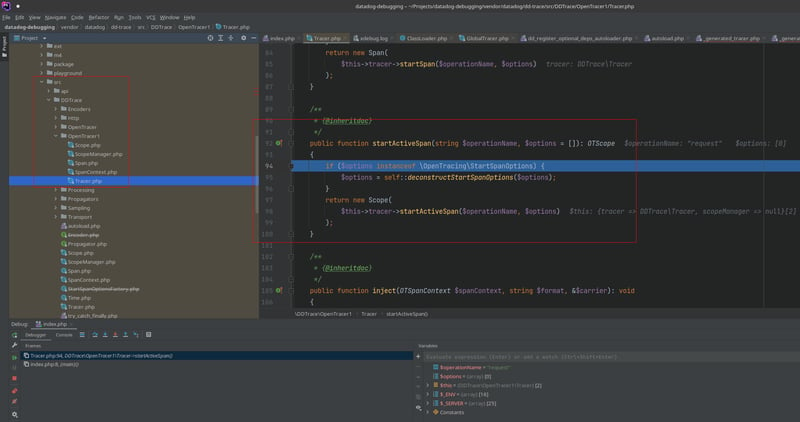
The code there is the same everywhere but in the end, what you see in the folder structure is not exactly how things are going to be executed. You might have also noticed that the last path is something we haven't mapped anywhere yet. I discovered it when the code was trying to start an active span. After pressing F7 to step into the function, I saw something like this:
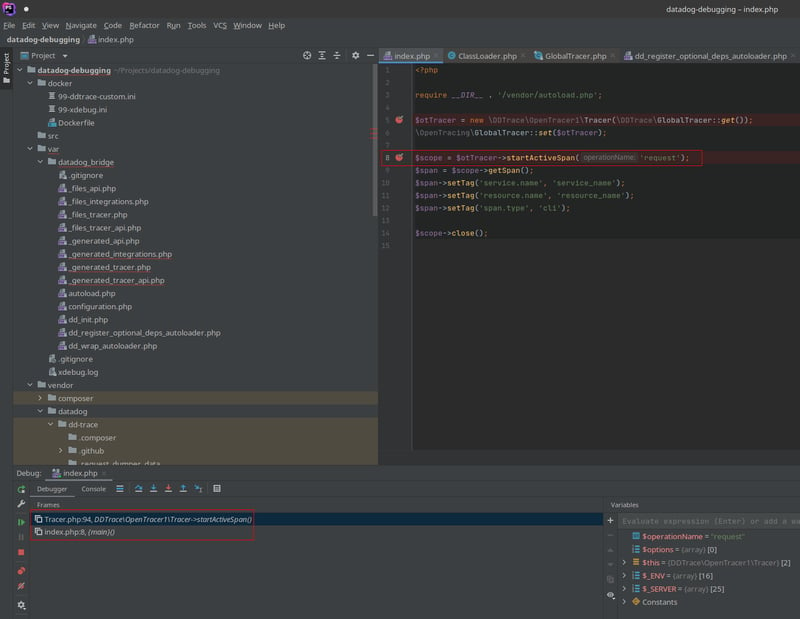
What we see here, is PhpStorm still being inside the index.php file on line 8 but the debugger tells us we are already inside DDTrace\OpenTracer1\Tracer class on line 94. That is where I realized one additional mapping was missing. How to figure out what path is the problematic one? Again - xdebug is our friend. Let's have a look at what the logs tell us:
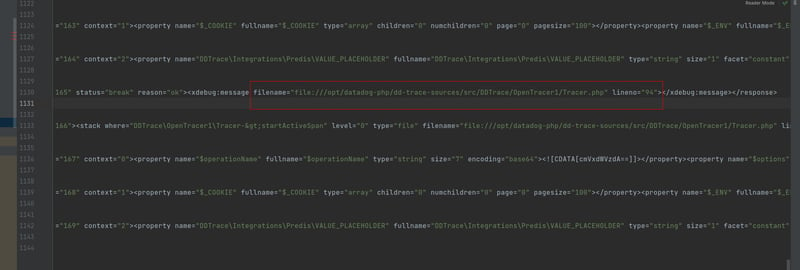
As we can see, yet another path is missing in our mapping. We can configure it like this:
If we step into the function now, we will end up exactly where we wanted:
And that's it. To sum it up, we have to:
- map the internal bridge code to our host with a named volume (if on docker; or in any other way depending on our environment)
- map the bridge code from the extension
- map the src code from the extension
We can now happily step through the datadog/dd-trace library.
You can find a demo project I used for this article on GitHub: https://github.com/awons/phpbyexample-datadog-debugging.


Top comments (0)