DEV Community

van
van

Posted on

Github: A High-Performance Library for Audio Analysis

Audioflux is a deep learning tool library for audio and music analysis, feature extraction. It supports dozens of time-frequency analysis transformation methods and hundreds of corresponding time-domain and frequency-domain feature combinations. It can be provided to deep learning networks for training, and is used to study various tasks in the audio field such as Classification, Separation, Music Information Retrieval(MIR) and ASR etc.

Project: https://github.com/libAudioFlux/audioFlux
Benchmark: https://github.com/libAudioFlux/audioFlux/issues/22

Benchmark for Linux-AMD

Top comments (2)

Collapse
 
audioflux profile image
van

To install the audioFlux package, Python >=3.6, using the released python package.Using PyPI:
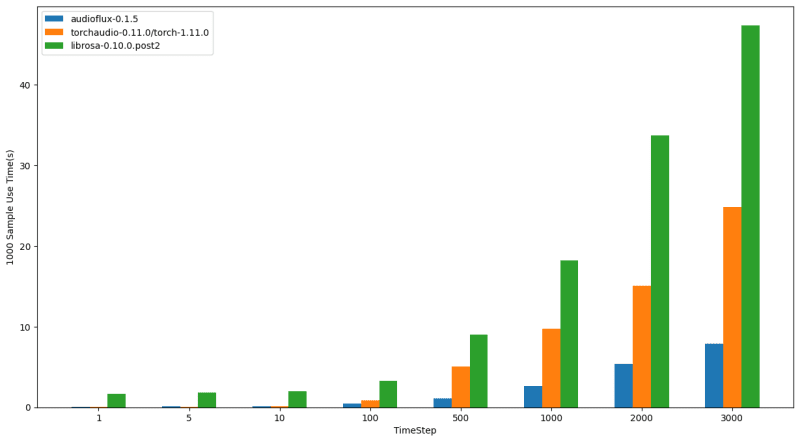
pip install audioflux

Mel & MFCC demo

import numpy as np
import audioflux as af

import matplotlib.pyplot as plt
from audioflux.display import fill_spec

# Get a 220Hz's audio file path
sample_path = af.utils.sample_path('220')

# Read audio data and sample rate
audio_arr, sr = af.read(sample_path)

# Extract mel spectrogram
spec_arr, mel_fre_band_arr = af.mel_spectrogram(audio_arr, num=128, radix2_exp=12, samplate=sr)
spec_arr = np.abs(spec_arr)

# Extract mfcc
mfcc_arr, _ = af.mfcc(audio_arr, cc_num=13, mel_num=128, radix2_exp=12, samplate=sr)

# Display
audio_len = audio_arr.shape[-1]
# calculate x/y-coords
x_coords = np.linspace(0, audio_len / sr, spec_arr.shape[-1] + 1)
y_coords = np.insert(mel_fre_band_arr, 0, 0)
fig, ax = plt.subplots()
img = fill_spec(spec_arr, axes=ax,
                x_coords=x_coords, y_coords=y_coords,
                x_axis='time', y_axis='log',
                title='Mel Spectrogram')
fig.colorbar(img, ax=ax)

fig, ax = plt.subplots()
img = fill_spec(mfcc_arr, axes=ax,
                x_coords=x_coords, x_axis='time',
                title='MFCC')
fig.colorbar(img, ax=ax)

plt.show()
Enter fullscreen mode Exit fullscreen mode

mel-mfcc

Collapse
 
audioflux profile image
van

In the field of deep learning for audio, the mel spectrogram is the most commonly used audio feature. The performance of mel spectrogram features can be benchmarked and compared using audio feature extraction libraries such as the following:

  • audioFlux: developed in C with a Python wrapper, it has different bridging processes for different platforms, and supports OpenBLAS, MKL, etc.
  • TorchAudio: developed in PyTorch, which is optimized for CPUs and uses MKL as its backend. This evaluation does not include the GPU version of PyTorch.
  • librosa: developed purely in Python, mainly based on NumPy and SciPy, with NumPy using OpenBLAS as its backend.
  • Essentia: developed in C++ with a Python wrapper, it uses Eigen and FFTW as its backend.