
In this guide, you will learn everything you should know to get started with OpenTelemetry, why logs and metrics aren’t enough to debug our distributed services, what distributed tracing is, and why we would need it in a distributed environment.
We will then take a deep dive into OpenTelemetry, its structure, deployment methods, and some best practices.
Introduction
As developers, one of the biggest aspects of our job is to respond quickly to incidents that occur in production and to resolve these issues as fast as possible.
To be able to do that, we need to gather a lot of information fast so we can understand the full picture of what’s going on in production and tackle these incidents as soon as they arise.
But with the adoption of distributed architecture, and as the number of services in many organizations increases, understanding and troubleshooting our system has become more complex.
The tools we used to rely on the most – metrics and logs – fail to deliver the necessary visibility across our distributed system.
This is where OpenTelemetry and distributed tracing come into play.
Distributed tracing is slowly becoming a crucial tool to pinpoint, troubleshoot and solve performance issues, errors, and more in distributed systems.
OpenTelemetry is currently the standard open-source for collecting distributed traces, which eventually help us solve issues in our system (more on that later).
Logs and Metrics Aren’t Enough to Debug our Distributed System
Metrics
Metrics provide us with a high-level view of our system’s health and if it behaves within our desired boundaries.
Metrics are great at showing you when behavior has changed. However, since metrics are so high level, we only know which application is experiencing a change in behavior (e.g., database) and what metric was changed (e.g. high CPU).
We do not have the relevant information as to why it’s happening, what the root cause is, and how we can fix it.
Logs
Logs are the trail of breadcrumbs we leave within our application to read them later and understand how the application is behaving. For example, if your application failed to write to the database, you’d be able to read that in your logs.
But in distributed systems, your code is also getting distributed, and with that, your logs. You end up having a distributed trail of breadcrumbs, which is extremely difficult to follow.
If logs are the story each service tells us, in a distributed system, suddenly we have 3 different stories, which makes it difficult to understand where we should investigate.
Our ability to understand where a problem lies diminishes as we continue to distribute our applications.
To be more specific, we lose the ability to correlate where an operation has started, where a simple request came from and the process it went through.
Logs - Low-level data point - breadcrumbs trail we leave within our application to read them later and understand how the application behaved.
Metrics - High-level data point - High-level health and behavior of our entire system; something is not working as expected from the system point of view
So metrics are too high level and only provide us with the status of the overall system and logs (while helpful as they offer more details) are too low level and don’t provide the full picture.
This is where distributed tracing makes the difference.
What is Distributed Tracing?
Distributed tracing tells us what happens between different services and components and showcases their relationships. This is extremely important for distributed services architecture, where many issues are caused due to the failed communication between components.
Traces specify how requests are propagated through our services. It solves a lot of the gaps that we had when we relied solely on metrics and logs

Each trace consists of spans. A span is a description of an action/operation that occurs in our system; an HTTP request or a database operation that spans over time (start at X and has a duration of Y milliseconds). Usually, it will be the parent and/or child of another span.
A trace is a tree/list of spans representing the progression of requests as it is handled by the different services and components in our system. For example, sending an API call to user-service resulted in a DB query to users-db. They are ‘call-stacks’ for distributed services.
Traces tell us how long each request took, which components and services it interacted with, and the latency introduced during each step, giving you a complete picture, end-to-end.
To learn more about the benefits of distributed tracing, read this quick article.
Distributed Traces with Jaeger Tracing
Traces are visual instrumentation, allowing us to visualize our system to better understand the relationships between services, making it easier to investigate and pinpoint issues.
Here’s what traces look like in Jaeger Tracing – an open-source tool that allows you to visualize traces.
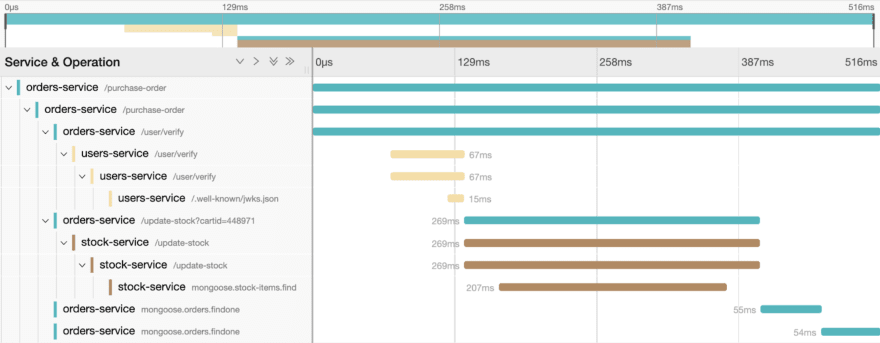
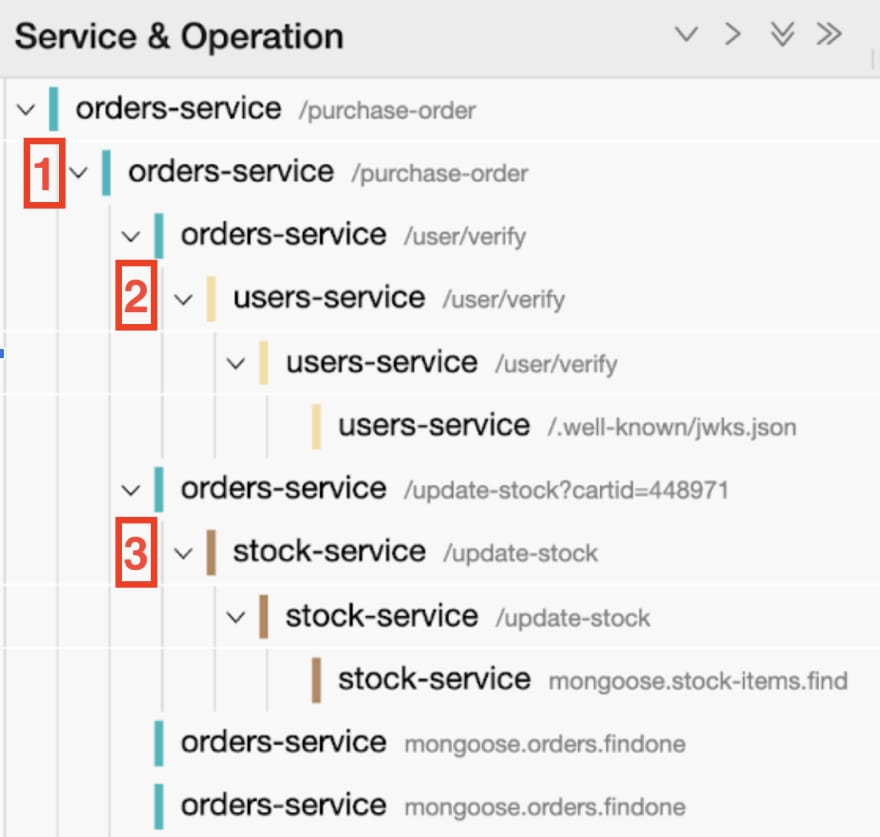
The Root Request and Event Order
This tracing data “tree” explains what the root request is and what was triggered by this action.
It essentially lays out the hierarchy and order in which each request was executed.
Within this tree, we have a parent-child relationship for each span. Each child span happened because of its parent span.
The very first request is made by the orders-service, which you can see is the very first span listed in the hierarchy. This is the “parent” span, which initiated the trace.
The order-service then communicates with the users-service to /users/verify.
Then the order-service sends an API call to stock-service to update the stock, which leads to the stock-service to run a .find operation on Mongoose.
Jaeger Timeline
This visualization details how long each request took, when it started, when it ended, and what happened in parallel or in sequence. That’s super important when we’re trying to identify performance issues and optimize different operations.
Each row within the timeline graph represents a span and the corresponding request listed in the hierarchy. You can now see which request took the most time.
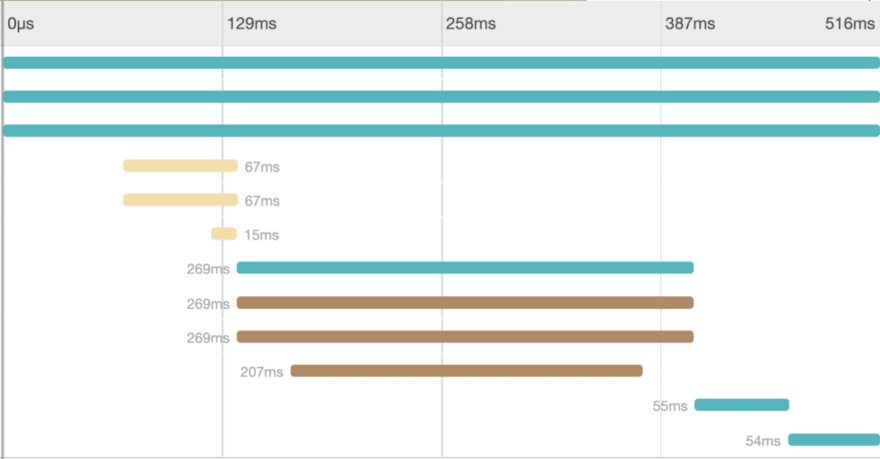
It’s important to mention that each operation is able to produce its own logs and metrics but now, by adding traces, we’re getting the full story, the full and visual context of the whole process.
The Three Types of Telemetry
Telemetry is the data we use to monitor our applications. It’s a term meant to cover a wide range of data types, such as metrics, logs, and traces.
To be able to troubleshoot our distributed system as fast as possible, and to get complete visibility into the process happening, we want to have these three data types – logs, metrics, and traces.
Logs - Breadcrumbs trail we leave within our application to read them later and understand how the application behaved.
Metrics - High level; Health and behavior of our entire system. Great for showing when behavior has changed.
Distributed traces - The context of what and why things are happening and the story of the communication between services, allow us to visualize the progression of requests as they move throughout our system.
Having a holistic view of all three gives you the visibility you need to pinpoint problems in production and solve them as fast as possible.
What is OpenTelemetry?
OpenTelemetry is an open source project, which, among other things, allows you to collect and export traces, logs, and metrics (also known as the three pillars of observability). It is a set of APIs and SDKs.
Led by the CNCF (Cloud Native Computing Foundation, same foundation responsible for Kubernetes), it enables us to instrument our distributed services, meaning, to gather data from the events that happen in our systems, which ultimately help us understand our software’s performance and behavior.
OpenTelemetry is unique for 3 main reasons:
- It is an open-source.
- Collects the three pillars of observability (logs, metrics and traces) and acts as the glue that brings them together.
- One specification respected by all vendors.
It is worth mentioning that at this time of writing, OpenTelemetry is still in its early stages, and bringing these telemetry data together is currently more of a vision than actual practice. You can follow the project’s status here. We also covered this topic in our Future of Observability article.
OpenTelemetry operates as a single library that captures all of this information, in a unified way and under a single specification, and ships it to your dedicated location (backend, collector, etc). This means that the OpenTelemetry data you collect can be distributed to many open sources (Jaeger and Prometheus) and vendors.
Since its implementation for most modern programming languages, it has been growing in popularity and usage by developers everywhere since it combines all three key aspects needed for proper monitoring (leading with tracing, followed by metrics).
As of today, many vendors are aligning to OpenTelemetry, which means:
- You can be vendor agnostic and not tied down to a single tool or platform.
- We’re able to send OpenTelemetry data to different vendors and open-sources for testing and comparison purposes with only a simple configuration change.
- Use fewer platforms and get the most out of each one.
Let’s go over the OpenTelemetry stack, what components you need in order to run OpenTelemetry, and how the SDK works.
The OpenTelemetry Stack
Generally speaking, the OpenTelemetry stack consists of 3 layers:
- Your application (in which you’d implement the OpenTelemetry SDK)
- The OpenTelemetry collector
- A visualization layer
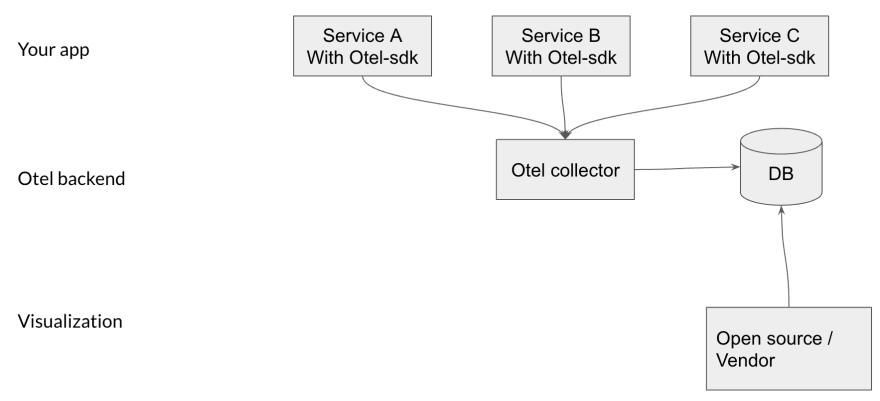
Your application – As soon as the SDK is implemented in your application and traffic starts to flow, data from all your services will immediately be sent to the OpenTelemetry collector.
OpenTelemetry collector – Once gathered, you can choose to send the data to a dedicated location (in the image above, we are sending the data to a database).
Visualization – You can then work with a third-party or an open-source to visualize the traces, as we did above with Jaeger.
Depending on your deployment strategy, you may not need to use all aspects of the stack.
OpenTelemetry Deployment Strategies
When discussing deploying OpenTelemetry, there are two components we need to consider:
- The SDK: in charge of collecting the data.
- The Collector: the component responsible for how to receive, process, and export telemetry data.
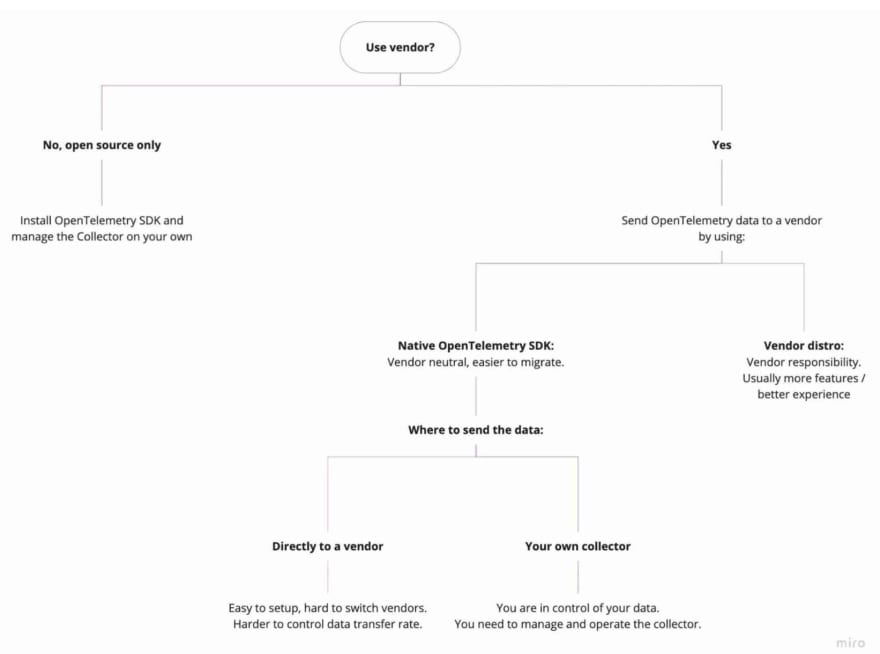
For each component, you can choose between the open source-only path, the vendor path, or a combination of the two.
The first thing you should ask yourself is: am I going to work with a vendor or do I want to only work with open source solutions?
Using both Vendor and Open-Source
How to collect the data (Native SDK or Distro)
- Vendor’s Distro – This option basically works by using the vendor’s OpenTelemetry distribution (also called distro) to instrument your services.
An OpenTelemetry distribution (distro) is a customized version of an OpenTelemetry component. Essentially, it is an OpenTelmetry SDK with some customizations that are vendor or end-user-specific.
- OpenTelemetry Native SDK – if you prefer not to use a vendor for this part of the process, you can use the OpenTelemetry native SDK.
Where to send the data (Collector)
The OpenTelemetry collector receives the data that is being sent by the SDK. It then processes the data and sends it to any destination you’ve configured it to, like a database or a visualization tool.
If you choose to install the OpenTelemetry native SDK, you can send data directly to the vendor or send data to your own OpenTelemetry collector that then sends it to the vendor for visualization.
In any case, you must install some OpenTelemetry SDK in your services. It can be either the OpenTelemetry out-of-the-box SDK or a vendor distro.
Pro tip: go first with vendor neutral unless you get significant value from using the distro.
Using pure Open-source
If you choose to go with pure open-source, you will be using the native OpenTelemetry SDK, the native OpenTelemetry collector, and an open-source visualization layer, such as Jaeger.
Bear in mind that if you choose this path, you’ll need to run the whole stack on your own, which will allow you to be extremely flexible but will require a lot of management and manpower. Everything you need to do to run a backend application, you will need to do here as well.
How does the OpenTelemetry SDK work?
So now that you know what OpenTelemetry is, what the stack looks like, and which deployment options you have, it’s time to take a look at what’s under the hood.
Let’s say your application has two services: service A and service B.
Service A sends an API call to service B and once that happens, service B writes to the database.
Both services have the OpenTelemetry SDK and we’re using the OpenTelemetry collector.
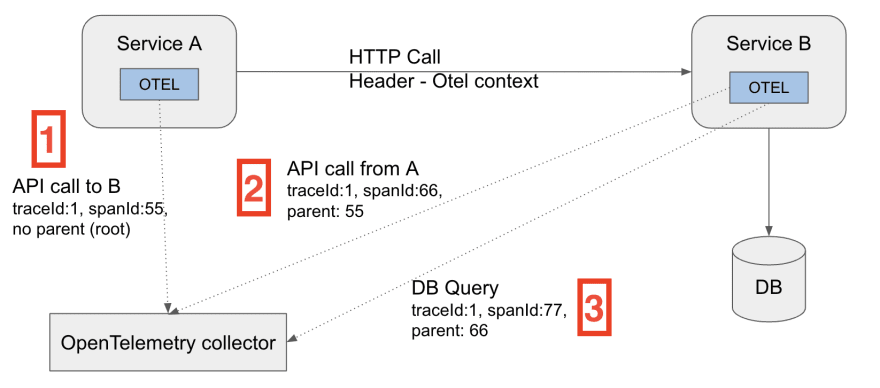
Once service A makes an API call to Service B, Service A also sends to the collector a span that describes the call to service B, essentially letting it know that it sent an API call (making it the parent in the trace).
There’s now a “parent / child” relationship between Service A and Service B (Service A being the parent of all the actions that follow).
OpenTelemetry injects the details about the parent span within the API call to Service B. It uses the HTTP headers to inject the trace context (trace ID, span ID, and more) into a custom header.
Once service B receives the HTTP call, it extracts the same header. From that point, any following action Service B takes is reported as its child.
All this magic happens out of the box.
This action brings another key aspect of OpenTelemetry – context propagation.
Essentially, it’s the mechanism that allows us to correlate spans across services. The context is transferred over the network using metadata such as HTTP headers.
The Header will include a trace ID, which represents the sequence of HTTP calls that were performed. It will also include a span ID, which represents the event – or span – that just took place.
Because service B has the SDK implemented as well, it will also send data to the collector, informing it that it has received an API call from service A (its parent).
The same goes for Service B’s call to the DB. It’ll create another span with the same trace ID as the initial trace ID created by service A.
OpenTelemetry Auto and Manual Instrumentation
As mentioned, OpenTelemetry allows us to instrument our system, meaning, to gather data from different libraries in our applications (e.g, AWS, SDK, Redis Client) and produce spans that represent their behavior.
There are two ways spans are created – Automatic instrumentation and manual instrumentations.
Here’s a quick TL;DR
- Auto instrumentations – you don’t need to write code to collect spans
- Manual instrumentations – you do need to write code to collect spans
Auto Instrumentation
These are ready-to-use libraries developed by the OpenTelemetry community. They automatically create spans from your application libraries (e.g., Redis client, HTTP client).
Once you send an HTTP GET using an HTTP library, the instrumentation will automatically create a new span with the corresponding data.
Manual Instrumentation
Manual instrumentation works by manually adding code to your application in order to define the beginning and end of each span as well as the payload.
Pro tip: aim to use auto instrumentations – Check the OpenTelemetry registry to find all available instrumentations libraries.
However, there are a few common use cases for using manual instrumentations:
Unsupported auto instrumentations – Not all libraries in all languages have a ready-to-use instrumentation. In that case, you want to instrument these libraries manually and even create and contribute an instrumentation on your own.
Internal libraries – many organizations create their own libraries (for various reasons), which require you to create your own instrumentation. If that is the case, here’s what you can do:
- Take inspiration from a similar open-source that has instrumentations.
- Follow the OpenTelemetry specification so that your visualization tool would work as expected.
Before you start working on manual instrumentation, you should know that manual instrumentations:
- Require good knowledge of OpenTelemetry
- Are time-consuming and hard to maintain
Learn hands-on how to use instrumentations in the OpenTelemetry Bootcamp:
Episode 2 – How to run an auto instrumentation
Episode 5 – How to create your own custom instrumentation.
Get Started with OpenTelemetry
In this guide, we covered the very fundamentals of OpenTelemetry. There is a lot more to learn and understand, especially if you plan on implementing OpenTelemetry in your company.
If you want to learn more, you can check out this free, 6 episodes, OpenTelemetry Bootcamp (vendor-neutral).
The Bootcamp contains live coding examples where you can follow along.
It’s basically your OpenTelemetry playbook where you will learn everything, from very hands-on basics to scaling and deploying to production:
Episode 1: OpenTelemetry Intro and Basic Deployment
Episode 2: Integrate Your Code (logs, metrics and traces)
Episode 3: Deploy to Production + Collector
Episode 4: Sampling and Dealing with High Volumes
Episode 5: Custom Instrumentation
Episode 6: Testing with OpenTelemetry
OpenTelemetry Glossary
Visit the guide for the full glossary.

Top comments (0)