Overview
This article is a case study for the design, development and implementation of a Construction Project Management & Monitoring System (PMMS) at a Global Construction Contractor. For the purposes of this article we are naming it Construction Data Insights (CDI) and will be referring to it as such going forward.
The need for CDI
In order to manage the dynamic information flows in the EPC business, the contractor has implemented the following solutions:
- Candy – for Estimation
- Primavera – for Project planning and Scheduling
- SAP - for Project Execution
These systems have been functioning independently in their areas of operation, as a result the data from these systems Is not collated and is not useful to business users in providing a holistic view of the Project.
Further each of these applications provide a solution that is specific to its function thus the information these provide – (e.g. Key Performance Indicators - KPIs) are focused to its domain, for instance:
- SAP provides KPIs related to financial performance – however these are not integrated with the Project Work-breakdown Structure. Thus in a scenario where a financial KPI in SAP is reporting a decrease in profitability it is not easy to determine which activities in the Project WBS are responsible for this.
- Similarly, Primavera provides KPIs related to the Planned Schedule – but these are not correlated to the Actual Execution Schedule and consequently Managers cannot determine project slippage easily and automatically.
- Candy provides the Budget but as it is not integrated with the SAP – comparing the budget with the Actual Cost structure requires manual intervention.
A side effect of this disconnected operation is that while there is a surplus of KPIs available to business users, it is not clearly established which KPI provides true business value.
In order to augment this Infrastructure a Project Management and Monitoring Analytics platform – Construction Data Insights has been implemented to make real-time Project Information accessible to the authorized decision-maker and higher management.
A holistic picture of the Project allows Project Managers, Departmental Heads and Strategic Decision Makers the appropriate levers to:
- Control Cost.
- Eliminate Project Schedule Slippage.
- Reduce Project Risks by managing unplanned project interruptions. # Approach ## Implementation Methodology In order to develop and deploy the solution we used the following methodology:
| # | Phase | Resources | Deliverables |
|---|---|---|---|
| 1 |
- Define the Scope. - Interview Business Users to define the Key Performance Indicators (KPIs). - Prepare Sample KPIs and Reports from sample data. |
Principal Consultant (onsite) | Sample KPIs and Reports. |
| 2 |
- Understand the existing IT infrastructure. - Determine the source of data to calculate the KPIs. - Identify Gaps in the Process and Information Architecture. |
Principal Consultant (onsite) + Technical Team (remote) | Define KPI & Report calculation process. |
| 3 |
- Implement System. - Resolve the Gaps Identified in Step 2 - Create Data-Warehouse and integrate with a reporting platform. |
Project Manager + Technical Team (remote) | Analytics Platform |
| 4 |
- Review Delivered platform with the End-Users obtain feedback and make necessary changes. - Train the end-users. |
Project Manager (remote) | User sign-off on platform reports and KPIs. |
Phase 1: Scope Definition
A side effect of the disconnected operation of these multiple systems is the lack of clarity of which data provides business value and is useful in decision-making.
In this phase we followed a process of defining which KPI is required of the business and what is the source for the data used to compute the KPI.
Defining Key Performance Indicators
The KPIs that the system generates and displays was determined through a process of review and analysis. The process followed in order to determine the KPIs that deliver maximum value was:
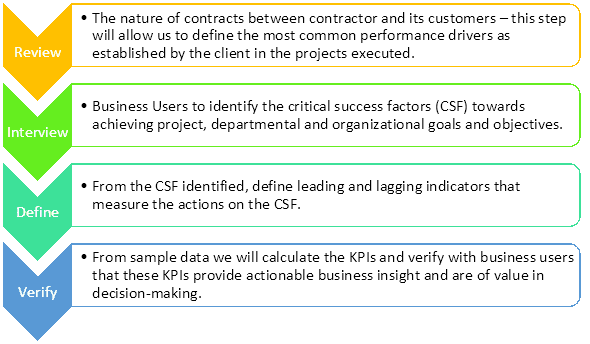
This phase was conducted on-site and took 2 months. At the end of the phase we prepared a list of KPIs that provided business value and also the data necessary to calculate these indicators.
Phase 2: Understanding the existing infrastructure, systems and data
Once the KPIs had been defined we started the process of understanding the existing IT infrastructure, deployed applications and how the data that gets collected.
Step 1: Determine source of the data
The goal of this phase was to determine the source of the data used to calculate the KPIs defined in phase 1.
For instance, we determined that the EVA (earned value analysis) method is critical to achieving project profitability objectives and we identified the source of:
- Planned Value:
- The Project WBS to be extracted from the Primavera Schedule.
- The Estimated Cost to be extracted from Candy.
- Actual Cost:
- The Project WBS extracted to be merged with the execution related data from SAP. #### Step 2: Mapping data between systems Once the sources had been identified the data to be extracted was reconciled with each system. This ensured that data fields in each system are mapped correctly to each other. (e.g. the Project Code in each system should refer to the same data field) #### Step 3: Identify Gaps in Process and Information Architecture In certain cases, we that require additional process functionality be built or the existing system be reconfigured to support the proposed solution.
For instance:
- We changed the Material Requisition Process in SAP to tag the relevant WBS from the drawing to ensure that we correctly identified consumption with the project plan. #### Step 4: Determine Transformation Rules Depending on the data to be transferred we recommended data update frequency and the rules necessary to transform the data from the source to the Data Warehouse.
The Transformation rules ensured that duplicate data was not transferred from the source systems and that any necessary data-cleansing is performed.
Phase 3: Implement the System
Once the KPIs and process and information gaps had been identified we built the system to support the solution.
Technical Approach
We created the following overall architecture for CDI:
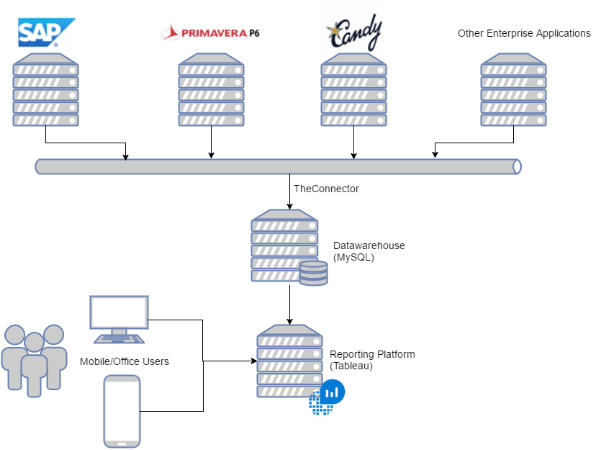
- The various enterprise applications – SAP, Primavera, Candy and additional applications (HRIS) were connected to the Data Warehouse (DW) – depending on the application, data will either pulled or pushed into the DW.
- ‘TheConnector’– is a custom application that was developed to manage the integration with the other enterprise applications. The connector layer performed the necessary Extraction, Transformation and Loading into the Data Warehouse. This happens asynchronously at an agreed upon frequency, and does not impact the performance of the existing systems
- Integration with SAP
- We used the following there approaches to integrate the system with SAP:
- 1: Identify the data necessary to be extracted from SAP and create reports using ABAP that generate delimited text files containing the data. These text files are then be loaded into the Data Warehouse. The ABAP report is automatically executed periodically (daily or hourly – depending on the data) and the data would be “pushed” through it. This option was used for high-volume data that does not need real-time synchronization with the data warehouse.
- 2: In the connector layer we use a BAPI component to “pull” the data from the SAP instance. This option is used for high-volume data that requires real-time synchronization with the data warehouse.
- 3: We developed a few ABAP web services for the required data. This option is suitable for low-volume data that needs to be synchronized in real-time.
- Integration with Primavera
- This was done by using the Primavera API called from a Java application that is part of the Connector Software layer.
- Integration with Candy
- Using the Candy API we exported the data from Candy into Excel files. These were then imported into the TheConnector where the appropriate transformation occurs and then the transformed data is loaded into the Data Warehouse.
- Data Warehouse (DW)
- The DW is the single repository of all data extracted and transformed (when necessary) from the various applications.
-
MySQL was used primarily from a cost and licensing perspective.
- Reporting layer
- The reporting (BI) layer generates the dashboards and KPIs to be used, We used Tableau for this. #### Key functionality of CDI CDI will contain the following sub-components (the components described in this section are sample screens/flows and there will be subsequent refinement and changes on these samples): ##### Project Portfolio Dashboard The Project Portfolio Dashboard (PPD) is the central point to the system and offers a global view of essential Key Performance Indicators (KPIs) to all Projects being executed. A critical need of business users is to find a single place to obtain all Project-specific information, the PPD addresses this issue.

The PPD contains the following main elements:
- List of all projects with Project-specific KPIs for each.
- Drill-down to Project specific information for each project selected from the list of Projects.
- Global KPIs to measure the performance of the portfolio projects as a whole.
Clicking on the Project specific information will allow the user to drill-down to the Project Dashboard.
Like the PPD the Project Dashboard too provides in one single screen easy access to a holistic view of the Project related KPIs necessary to monitor Project Performance and take corrective action where necessary.
Project Dashboard
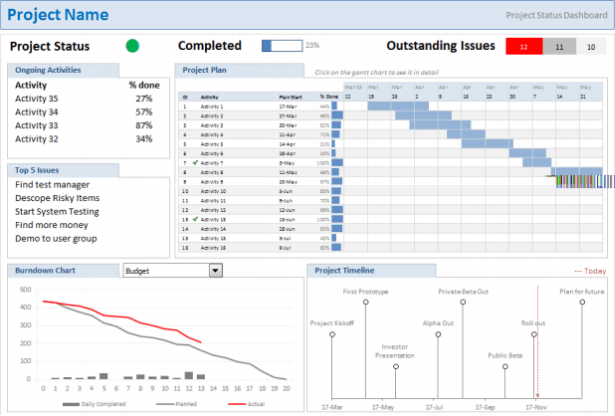
The Project Dashboard displays KPIs applicable to a specific Project. The key elements of the Project Dashboard are:
- Traffic Light Status – Red/Amber/Green
- Based on Completion, Time Slippage etc. (the exact algorithm for the Traffic Light will be determined during the course of our analysis stage)
- High Priority / High Impact Project issues and risks.
- A list with the top 5 (or some limited #) of high priority and/or high impact issues that will be recorded in the Issue Tracking and Management System.
- Various Planning and Tracking Graphs
- Project S Curve
- Burn-down Charts
- Calendar
- Project Timeline
- Timeline of Key Project Events – work start, planned finish etc.
- Resource Calendar
- Calendar of when, what resource is required for the Project Execution.
- Project Timeline
The KPIs in both these dashboards are computed with a reasonable lag (24 hrs or less) from real-time thus allowing decision makers quick and easy access to near real-time Project Information.
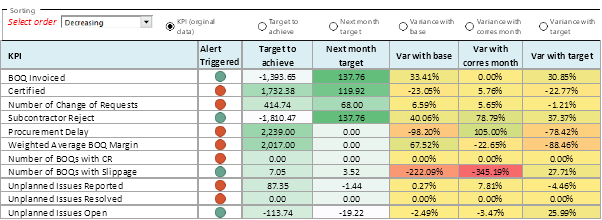
KPI Thresholds & Alerts
Each of this KPIs also have Thresholds to be built for them. Once the thresholds have been defined a subscription rule can also be created. The subscription rule defines the responsible business users who will be notified once a specific KPI limit has been breached.
This ensures that business users will stay on top of Project Progress and Performance without having to continuously monitor a report or a dashboard.
A dashboard to view the alerts triggered is a part of this feature:
Issue Tracker
Unplanned Issues will arise throughout a project implementation. In order address these issues and mitigate effects on Project Schedule and Profitability – the issues need to be tracked and speedily resolved.
The Issue Tracker highlights project issues and allows the assignment of issues to individuals to resolve, monitor and track thus fulfilling this need.
In broad terms the issue management cycle follows this process:
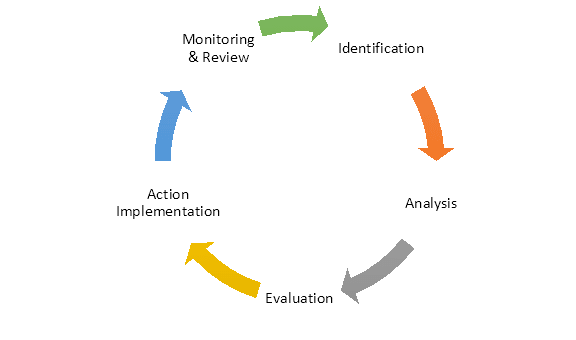
The Issue Dashboard presents all issues that have been reported and provides a quick view of the volume of issues awaiting resolution or resolved.

Project Cost Report
In order to control cost – one must drill-down to the project’s activities to determine the budget vs. actual, committed costs and estimate to complete. The Project Cost Report or PCR fulfils this need by providing an analysis of the Cost Structure of a Project at all levels of the Work-Breakdown Structure of a Project.
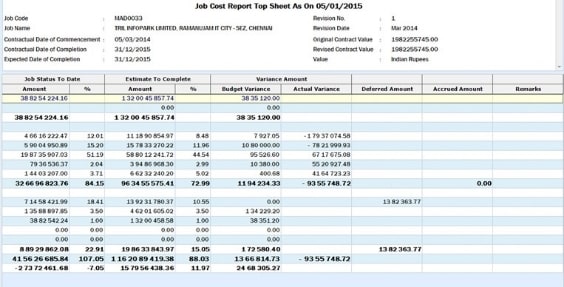
The PCR captures the following key elements of the cost structure:
- Original Estimate and Revisions to the Estimate if any.
- Actual Cost incurred.
- Estimate to Complete (a.k.a Cost to Complete)
- Variance of Actual to Budget ##### Project Progress Report A critical deficiency of the existing IT implementations is the inability to easily obtain real-time information about the progress of a Project site. The Project Progress Report (PPR) captures all the activities at a project site and ensures that real-time information on project site activities are easily accessible to business users.
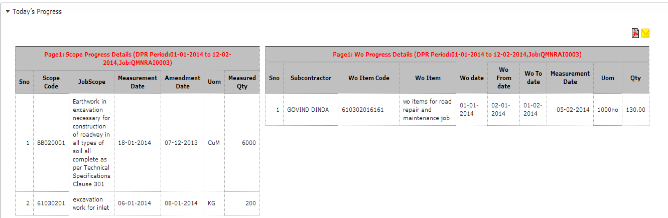
The PPR comprises of the following elements:
- Work Progress: For each Subcontractor Item as well as client deliverable the Quantity Executed is displayed.
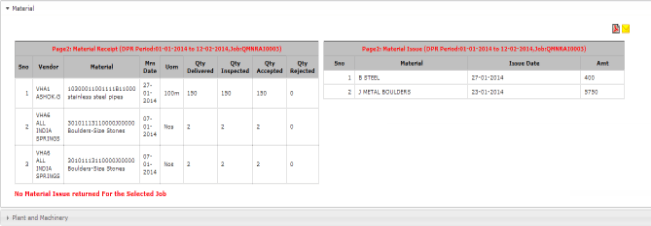
- Material Status: All Material Deliveries, Consumption and Subcontractor utilization is reported.
Plant & Machinery: Machinery requisitions, movement and utilization information is displayed
Phase 4: Delivery Methodology
Once the application was ready and tested – the solution was delivered to Business Users for Acceptance and User Training. Additional feedback from the users were alos incorporated into the delivered dashboards and reports.
In this Phase the steps were:
Step 1: Conference Room Pilot (CRP) and Acceptance
We conducted three CRPs. In the first CRP we reviewed each business process and how they reside within the solution. Then each process was demonstrated in the system, for instance we took a transaction in SAP, see how it flows through the system and see how it is displayed in CDI.
Users completed the task individually and we noted all of the passes and fails of each step and noted any lack of functionality, software bugs or key usability issues. The issues identified in the first CRP were resolved and a second CRP conducted.
In the second CRP session and third CRP sessions we reviewed the issues identified by the users and reviewed the resolutions making a final pass on all processes and recorded that the issues have been resolved and the system accepted for use.
Step 2: User Training
We conducted User Training post acceptance in a closed session.
Appropriate artefacts including User Manuals and Training Videos for users to use the system were also prepared
Step 3: Go-Live
Once User Training was completed the system went live.
Conclusion
This project was executed and over the last two years during the COVID-19 pandemic provided an excellent tool for management to monitor global construction projects at scale and at a granular level.

Top comments (0)