
Web Performance is really one of my daily concerns for the clients I am working with at Netcentric.
Sometimes convincing them to focus on web performance is not an easy task: it’s never clear what will be the gain compared to the effort we are putting in it, and as you might already know, web performance is all about measurements.
By the time we decide to implement a feature for our clients, it can take weeks before we can see it live and finally measure the improvements, and there is always the risk that the rewards are not what we were expecting.
I wanted to show one of our clients that we should focus on optimizing what’s happening in the <head> section of their page, and again I couldn’t go with my "feeling" that it could be good for their performance. I wanted to show them some real numbers that would help me convince them that it was an important topic.
Luckily today, I was able to find a set of tools that would help me achieve my goal.
Building a Proof of Concept (PoC)
The first thing to do when it comes to web performance is to get a picture of the current status, so we can easily see the comparison before and after our work.
The Chrome DevTools Performance tab offers a lot of very interesting information, but it can sometimes be really hard to understand, especially for not-too-technical people, with all the information it provides:

So, I decided to use some custom metrics using the Performance API to get a rough idea of what was time-consuming on the page I was auditing.
The first step was to go to the homepage of our client and use the Overrides feature of Chrome to be able to inject my own piece of Javascript.
First, I opened Chrome DevTools, went to the "Sources" tab, followed by the "Overrides" panel:
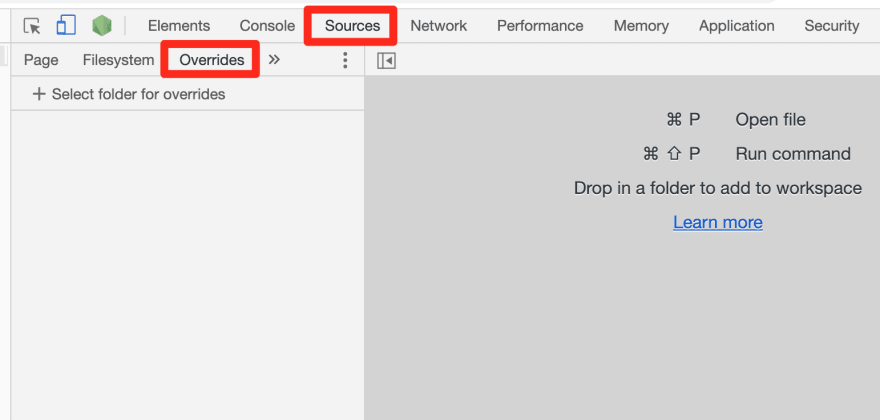
From here, I clicked on "+ Select folder to overrides" and selected an empty folder I just created (You can also create a new one directly from the dialogue box).
Once selected, Chrome prompts you to allow access to this folder, so don’t forget to click on the "Allow" button:

Then, from the "Sources" tab, I went to the "Page" panel and opened my main HTML file (in my case, en.html):
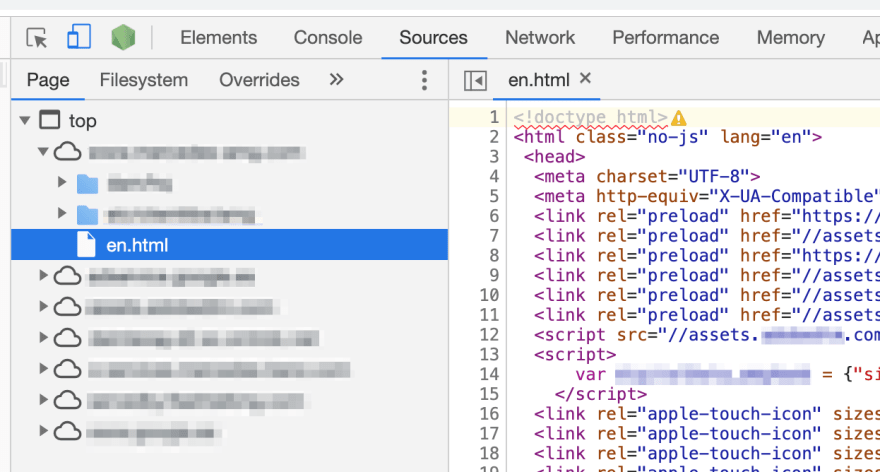
On the right side, I was able to inject my Javascript for my custom metrics. I used two functions: performance.mark() and performance.measure().
The Performance API is very easy to use, for example:
// Start your measure
performance.mark('begin');
// Put everything you want to measure between the marks
// Stop your measure
performance.mark('end');
// Calculate the time difference between your 2 marks
performance.measure('diff', 'begin', 'end');
// View the results in the Performance tab
// or output the results in the console using:
console.log(performance.getEntriesByType("measure"));
You should see something similar to this in your console:

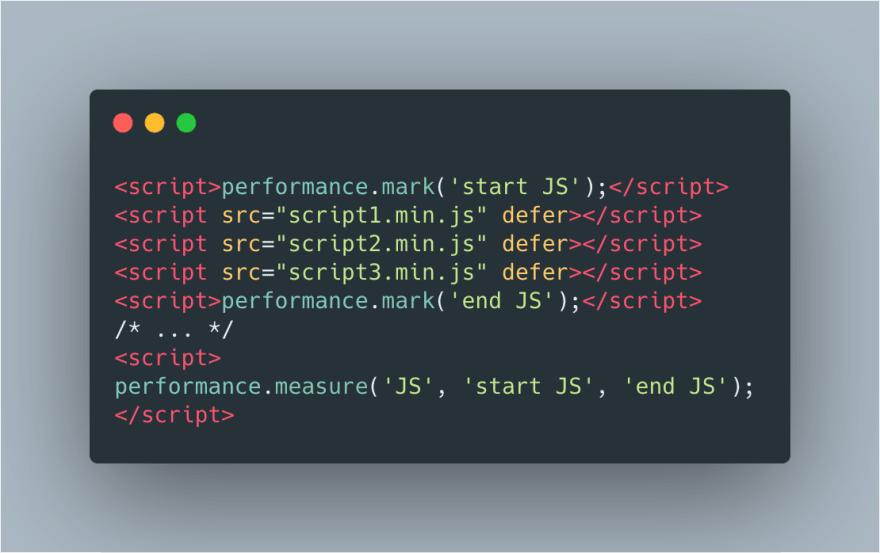
Finally, the code had the following structure for my page:

Once done with injecting my performance marks inside my HTML, I switched to the "Performance" tab, made sure I selected a "Fast 3G" network and "4x slowdown" for the CPU, and finally clicked on "Start profiling and reload the page":

After a couple of seconds, I was able to see my report with some interesting information. The section I wanted to check was the "Timings" panel where I could find my custom metrics along with some default user metrics provided by Chrome, e.g. First Contentful Paint (FCP), First Meaningful Paint (FMP), Largest Contentful Paint (LCP), ...
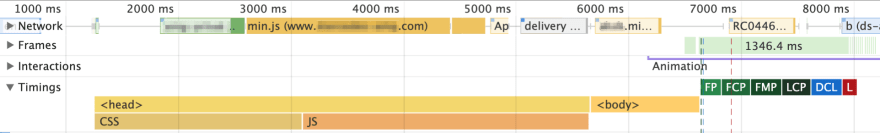
What I saw there was that parsing the <head> section was taking 4.40s (CSS 1.85s + JS 2.55s) for ~50 lines when parsing the <body> section was only taking 0.97s for ~1300 lines.
With that, I had a baseline for measuring my improvements. Time to optimise!
The first optimization I tested was adding a defer attribute to my Javascript files:
So back to my "Sources" tab, I opened the HTML file and added the defer attribute, and ran a new "Performance" test:

Checking the "Timings" panel again, I could now barely see the JS parsing time, which was down to 8.66ms. The total <head> section was also down to 1.65s, where most of the time was now only spent on the CSS.
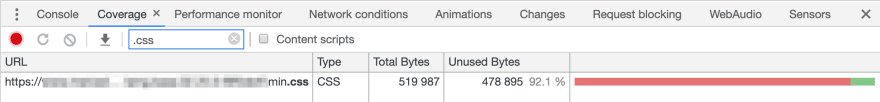
I now wanted to see if I could also reduce the time spent on the CSS. So I went to check the "Coverage" tab (cmd+shift+p), opened it and clicked on "Start instrumenting coverage and reload the page":

Since I only wanted to see the CSS coverage, I used the filter .css and what I could see was that 92% of the CSS I was loading was not used. (Unused bytes will change in real-time when you start interacting with the page):
That was a lot of data loaded for nothing, and I wondered if I would have some gain removing unused CSS. To achieve this, I had a couple of solutions and tools like Purgecss, uncss or PurifyCSS for example, that could help me remove all the unused CSS on the homepage. I decided to use the last one as it was providing an easy user interface which was enough for my PoC.
For this tool, just put the URL of your website and click on "Clean up CSS". (I didn't check exactly how accurate this tool was as I just wanted to have a rough idea in my case).
Once it's done, I clicked on the "show clean css code" button and copied the new CSS.
Back to my DevTools and the "Sources" tab, "Page" panel, I selected my CSS file, pasted the cleaned CSS code I got in the previous step and saved my changes (ctrl+s).
And finally, I ran another "Performance" test:

In the end, after only those two optimizations, parsing the <head> section was only taking 0.63s, and most of this time was spent on the CSS (0.61ms). Knowing that our baseline metric was 4.40s, that was a total improvement of around ~85%!
Conclusion
The goal of this PoC was to convince our client to focus on Web Performance without going through the whole internal development process that would take weeks and without having any guarantee of the gains.
The PoC took me 2 hours to prepare, however, the real development will take a few weeks. Having all of our baseline measurements already done also lets us measure again once we are ready to go live and see the final real gain.

Top comments (1)
Great article. i learned new things !
but i am still don't understand if i can see here the FID, TBT that we see in PageSpeed Insights
in my page i am testing, the head is only 30ms, body 430ms
so it seems that the rendering is taking most of the time
any way i can get some insights regarding the rendering ?
Thanks