
I recently worked on a problem, the solution of which required geospatial querying and transformations. I initially thought of doing everything in-memory
using a JavaScript library called turf. This was going fine until I used the actual dataset (I had around 24,000 Polygons having vertices ranging from 50 to 5,000), this is where I guess both the time and
space complexities of the operations I was doing via turf became too large, and it just gave up.
This is the point where I had to move to PostGIS in order to do those operations.
Someone might argue that out there is so much dedicated GIS software like QGIS, ArcGIS, why not use them. The answer is simple, it’s not only the GIS work that I am doing on my database, but there are also lots of regular CRUD operations as well, and PostGIS is just an extension to Postgres, which makes it perfect for this kind of use cases. And if you are thinking of suggesting me Mongo, I am gonna stop you right there, Mongo supports few geospatial queries but has no geo-transformation capabilities at all.
In case you are worried to set up Postgres in replication mode and all, you can always use an RDS instance. Recently I have been
hearing a lot of good things about Amazon Aurora as well.

But let’s define the problem statement first
Problem Statement
Let’s say that you want to set up a fast-food chain in New York. But you want to
strategically place your restaurants to get the max customers, hence you decided
these criteria
- No restaurant should be near 205 meters of a KFC
- All restaurants should be in 300 meters of KFC
- All restaurants should be inside New York
You have to also generate the result in a GeoJSON file so that, that can be
drawn onto a map for better visualization.
We are going to use GeoJSON to represent geometries throughout
Simple right? 😏 Let’s dive into code.
Environment setup
- I am going to do this in node.js, hence download and install that.
- I am not going to install
postgresand use adocker imageinstead, so download and install docker. - Running these two commands in the image below consecutively will pull the docker image for PostGIS and start a container.

I am going to use
node.jsfor this, don’t worry if you don’t understand
JavaScript/ TypeScript, I am not going to use any language-specificObject Relational Mapper, I will execute raw PostGIS queries from code, which will make it language agnostic.
Available Data
Let’s assume that we already have the boundary information of New York and all the KFCs there. For the sake of simplicity, I will not use the actual data but use a Polygon to represent NY and multiple Polygons to represent KFCs.
This is our imaginary NY (in gray), and KFCs (in red)

These Polygon boundaries are available in .json files, which you can find
here.
Project Setup
I am going to set up a very simple node.js + TypeScript console application.
If you are following along, you don’t have to again do that, you can download the template project from here. This already has all the bootstrap and boilerplate code ->Branch_link
I am going to divide the entire problem into multiple small tasks and solve it step by step.
I will share certain branches of my repo after each task, which contains the complete solution to that particular task. So don’t get baffled by small code snippet.
This is done so that you try to write the code yourself, which adds an active learning kind of flavor. Also, the complete solution would also be provided at the end of the article. Try to follow as much as you can, in case you fail, you
can always check out the branch for that task.If you didn’t understand this, then you probably need to learn Git first, which I will not explain, but you can learn it from here.
Task 1: Insert the NY Polygon and KFC Polygons into DB
Ok, so we need to first insert all the related data into the DB so that we can query/ operate on it.
To do so, I ended up writing these two files.
- The first is the
postgresPool.tsfile
import { environment } from './../environment';
import * as pg from 'pg';

export async function getPostgresPool() {
    const pool = new pg.Pool({
        user: environment.postGisDBCreds.user,
        host: environment.postGisDBCreds.host,
        database: environment.postGisDBCreds.database,
        password: environment.postGisDBCreds.password,
        port: environment.postGisDBCreds.port
    });

    await pool.connect();
    return pool;
}
Which basically instantiates the postgres connection pool, which you can use to query the DB.
- And the second is the
index.tsfile
#!/usr/bin / env node

import * as pg from 'pg';
import * as newYork from './input/ny.json';
import * as kfcs from './input/kfcs.json';
import { getPostgresPool } from './dbClients/postgres-pool';
import { logGreen } from './logger';

main();

async function main() {
    const postgresPool = await getPostgresPool();
    await insertNYBoundary(postgresPool);
    await insertKFCBoundaries(postgresPool);
    logGreen('Execution complete');
}

async function insertNYBoundary(pgPool: pg.Pool) {
    const nyBoundaryTable = 'ny_boundary';
    const tableCreationQuery = buildTaleCreationQuery(nyBoundaryTable, pgPool);
    await pgPool.query(tableCreationQuery);

    const insertionQuery = buildInsertionQuery(JSON.stringify(newYork.geometry), nyBoundaryTable);
    await pgPool.query(insertionQuery);
}

async function insertKFCBoundaries(pgPool: pg.Pool) {
    const kfcBoundariesTable = 'kfc_boundaries';
    const tableCreationQuery = buildTaleCreationQuery(kfcBoundariesTable, pgPool);
    await pgPool.query(tableCreationQuery);

    const insertQueries = kfcs.features.map(kfc => buildInsertionQuery(JSON.stringify(kfc.geometry), kfcBoundariesTable));
    insertQueries.forEach(async insertQuery => await pgPool.query(insertQuery));
}

function buildTaleCreationQuery(tableName: String, pgPool: pg.Pool) {
    return 'create table if not exists ' + tableName + ' (id serial primary key, geom geometry)';
}

function buildInsertionQuery(data: any, table: String) {
    const queryPart1 = 'insert into ' + table + ' (geom) values (ST_GeomFromGeoJSON(\'';
    const queryPart3 = '\'));';
    const query = queryPart1.concat(data).concat(queryPart3);
    return query;
}
I know, I know it’s long, but let me explain, it’s pretty simple actually. The flow is like this
- Create a table with the name
ny_boundary, having 2 columns, id, and geom. - Read the geojson file
ny.jsonand insert that into this table. - Create a table with the name
kfc_boundaries, having 2 columns, id, and geom. - Read the geojson file
kfc.jsonand insert that into this table. - buildTableCreationQuery and buildInsertionQuery are basically 2 helper methods that generate the query for you given the data.
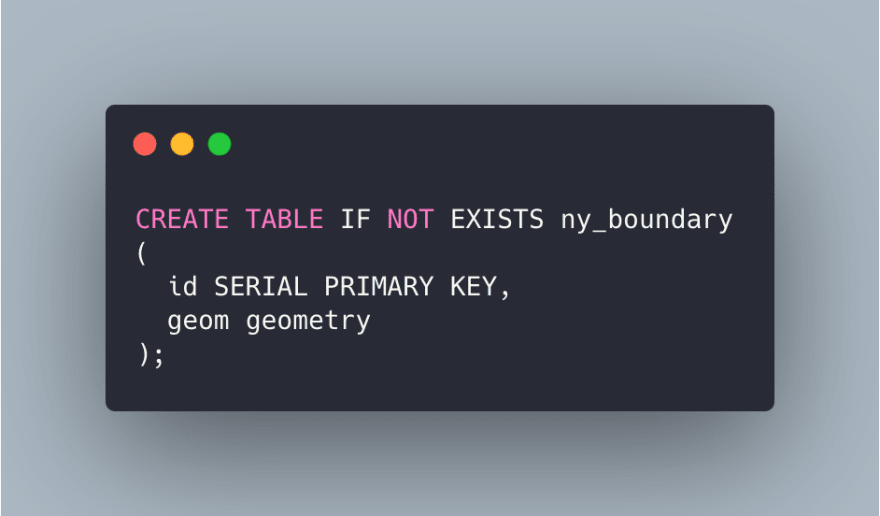
This is how the create table query would look if you run it as a SQL command
And the insert SQL query

We are using the ST_GeomFromGeoJSON function, cause the data we have as input is in geojson format.
And that concludes the task1, woot woot 🕺
And in case you could not follow along, here’s the ->
branch_link that I promised. The boundary geojson files are at /src/input
Task 2: Expand KFC boundaries by 205 meters and merge them if overlapping
Now this task has 2 sub-tasks.
- Expand the KFC boundaries by 205 meters, this will give us the area where we should not put our restaurants.
- We need to merge the expanded boundaries if there’s an overlap between any of them. Cause merged polygons look much better than overlapping polygons when rendered on a map. There are other benefits as well as it reduces the data size, which can matter when dealing with huge data.
Ok, the code to achieve this
async function expandBoundariesBy205Mtrs(pgPool: pg.Pool) {
    const level1Boundaries = 'level1_boundaries';
    const tableCreationQuery = buildTableCreationQuery(level1Boundaries, pgPool);
    await pgPool.query(tableCreationQuery);

    const expansionQuery = buildExpansionQuery(205);
    const expandedBoundaryInsertionQuery = 'insert into ' + level1Boundaries + ' (geom) ' + expansionQuery;
    await pgPool.query(expandedBoundaryInsertionQuery);
}

function buildExpansionQuery(distanceInMeters: number) {
    return 'select st_union(array (select st_buffer(geom::geography, ' + distanceInMeters + ' )::geometry from kfc_boundaries))'
}
Again, let me explain. I am doing two things.
- Creating a
level1_boundariestable. - Expanding all
kfc_boundariesby 205 meters, merging them, and then inserting them into thelevel1_boundariestable.
I know the query part for the second operation might look a bit complex, a lot of things are going on there. So I will break down the parts of the query and try to explain what’s going on.
This is the query that we basically ran.
insert into level1_boundaries (geom) select st_union(array (select st_buffer(geom::geography, 205 )::geometry from kfc_boundaries));
 st_buffer(geom::geography, 205 )::geometry
 kfc_boundaries
st_buffer -> This is the function which does the expansion operation, it takes two params, one is the geometry/ geography object, and the other is the radius for expansion. Which are geom and 205 for our case.
*geom::geography *-> This is typecasting operation. We are taking the value of the geom column from kfc_boundaries and typecasting it to a geography object.
We need to this so so that the function considers the geom value as a EPSG:4326 geometry and hence it will consider the 205 as meters. If you don’t do this typecasting, the st_buffer function will consider the value 205 meters to be 205 degrees.
::geometry
We are again converting the result of the buffer operation to a geometry object, as st_union can only operate on geometry objects.
st_union(array(...))
*st_union *-> This function merges the geometries returned from the st_buffer function if there are overlapping polygons it merges them into a single polygon, if the polygons are disjoint it creates a multipolygon out of them.
*array *-> As the kfc_boundaries table has multiple rows, the select st_buffer ... query will return an array, so to specify that it’s an array input, we are using this.
insert into level1_boundaries (geom) ...
This basically inserts the result of the st_union operation into the level1_boundaries table.
Putting it together, this is how it looks now

Blue polygons -> KFC boundaries expanded by 205 meters
Red Polygons -> KFC boundaries
That’s the completion of task 2, and here’s the ->
branch_link
Task 3: Repeat step 2 but for a distance of 300 meters
Here’s the code
async function expandBoundariesBy300Mtrs(pgPool: pg.Pool) {
    const level2Boundaries = 'level2_boundaries';
    const tableCreationQuery = buildTableCreationQuery(level2Boundaries, pgPool);
    await pgPool.query(tableCreationQuery);

    const expansionQuery = buildExpansionQuery(300);
    const expandedBoundaryInsertionQuery = 'insert into ' + level2Boundaries + ' (geom) ' + expansionQuery;
    await pgPool.query(expandedBoundaryInsertionQuery);
}
Nothing new, and here’s everything rendered on a map.

Light green Polygons -> KFC boundaries expanded by 300 meters
Here’s the ->
branch_link for this task.
Task 4: Subtract level 1 boundaries from level 2 boundaries to find out the
green zone
Now we have 2 MultiPolygons
- Boundary + 205 meters -> level 1
- Boundary + 300 meters -> level 2
We need to do
level2 - level1
To find out the green zone, where we can set up our restaurants.
Here’s the code
async function subtractLevel1FromLevel2(pgPool: pg.Pool) {
    const boundaryDifference = 'boundary_difference';
    const tableCreationQuery = buildTableCreationQuery(boundaryDifference, pgPool);
    await pgPool.query(tableCreationQuery);

    const level1 = (await pgPool.query('select geom from level1_boundaries')).rows[0].geom;
    const level2 = (await pgPool.query('select geom from level2_boundaries')).rows[0].geom;
    const query = "insert into " + boundaryDifference + " (geom) select ST_Difference(\'" + level2 + "\',\'" + level1 + "\');";
    await pgPool.query(query);
}
The flow is like this
- Create a table named
boundary_difference - Find the level1 boundary (the table has 1 row, hence for simplicity, I am using the first row only)
- Find the level2 boundary (the table has 1 row, hence for simplicity, I am using the first row only)
- Find the difference between these two objects using the
st_differencefunction. It takes two geometries, finds out the difference between them, and gives back the difference as a geometry object. - Store the difference in
boundary_differencetable.
And here’s the outcome drawn on a map

Here’s the ->
branch_link for this task.
Task 5: Find the intersection of NY boundary and green zones
You can see that some parts green zone which we just found out is going outside the NY boundary, and we do not want to set up our restaurants outside NY. Hence what we have to do now is to find out the intersection of the NY boundary and the green zone.
Here’s the code
async function findIntersection(pgPool: pg.Pool) {
    const ny = (await pgPool.query('select geom from ny_boundary')).rows[0].geom;
    const difference = (await pgPool.query('select geom from boundary_difference')).rows[0].geom;
    const query = "select st_asgeojson(ST_Intersection(\'" + difference + "\',\'" + ny + "\'));";
    const newLocal = await pgPool.query(query);
    logCyan(JSON.stringify(newLocal.rows[0].st_asgeojson));
    writeFile('green_zones', JSON.stringify(newLocal.rows[0].st_asgeojson));
}
Flow
- Get the NY boundary and Difference calculated before
- Find out the intersection between them using
st_intersection, which has a similar signature asst_difference, takes two geometries, and returns the intersecting area as a geometry object. - Convert the result into
geojsonusingst_asgeojson - Print the result in the console
And here’s the final picture, rendered on a map.

You can set-up you dream restaurant chain now 😆
And that my friend, concludes this tutorial on using some of the basic
functionalities of PostGIS to some pretty cool geospatial tasks.
You can download the complete solution from here.
Feel free to drop a comment if I got something wrong, I would love to improve.
If you learned anything, don’t forget to show support by pressing those like buttons.
You can find me on Linkedin,
GitHub. I would love to connect/ collaborate.
Happy learning! 😺

Top comments (5)
very nice article.. thanks for sharing it. one question how did you render on a map of all these polygons?
google maps or osm?
if its osm,can you please tell how did you do it?
Looking at the screenshots, it appears @aritra used geojson.io to render the GeoJSON output from the PostGIS queries. This a great tool for creating spatial data or for viewing spatial data stored formatted to meet the GeoJSON specification.
To the question of rendering, it is worth noting that OSM itself is not a renderer. It is a source of data that can used in a lot of different ways, including tiling into the basemap you see in the screenshots. However, there are multiple APIs and software that can render these map tiles. For JavaScript, Leaflet, OpenLayers, ArcGIS JS API, Mapbox GL JS, and Tangram are examples of APIs you can use to render GeoJSON feature data atop tiled basemaps. It is less important what the source of the data is in the basemap tiles than that the basemap is tiled in a way that these APIs can render them properly. Google makes the distinction between data source and renderer murky because their basemap tiles are the default for the Google Maps API.
Got it, Thanks
Thanks, Ryan. You are absolutely right on what you said.
Hey, I used geojson.io to render the maps.
Also, I was using dbeaver, where the result of any particular query/ any row of a table can also be visualized on a Mapbox map.