
Most of the time, the default application monitoring metrics, graphs, and visualizations provided by AppSignal will do for your Ruby app. However, you might be the kind of user who likes a bit of control over what is measured, how it’s displayed, and how critical information about your app should be relayed.
AppSignal allows you to customize app metrics and dashboards as you wish. In this guide, we’ll learn all about AppSignal's custom metrics, including:
- What custom metrics are
- The different types of custom metrics you can set up
- How to customize graph visualizations
- How to set up effective alerts
And more!
But before we dive in, you'll need a couple of things to follow along.
Prerequisites
- An AppSignal account: If you don't have one, sign up for a 30-day free trial.
- A Ruby application: This app can be based on any supported Ruby framework, like Rails, Sinatra, or just plain Ruby. Additionally, it can be a production or development app. If you don't want to spin up your own app, clone the code for the example Sinatra app we'll be using in this tutorial.
Note: If you're using your own app to follow along with this tutorial, make sure your app is configured to use the latest AppSignal Ruby gem, as the examples used in this tutorial assume this is the case.
What Are Custom Metrics?
Other than measuring your app's error rates, throughput, and performance, you might be interested in measuring custom data specifically tailored for your own app. For example, you could be interested in how many visitors signed up to your app in a particular time period, how your app's websocket layer is performing, and so forth.
For such customized cases, you might be hard-pressed to find a standard measuring tool within AppSignal. Instead, you'll need to use a custom metric. Custom metrics are additional metrics that you define alongside the default ones for deeper context on how your app is running.
Next up, let's learn how to set up our first custom metric.
Setting Up Custom Metrics
You can set up a custom metric for almost any use case within your application. Let's start with a simple example to help you understand how everything fits together.
The first step is to define a custom metric that will be tracked on AppSignal. You can define a custom metric by using the different metric types available:
- Gauges
- Counters
- Distributions
The Gauge Custom Metric
In AppSignal, a gauge custom metric is useful for measuring metrics that increase and decrease over time.
Let's set up a simple gauge custom metric to measure the total number of posts in our example Sinatra app:
# app.rb

require 'sinatra/base'
require 'dotenv/load'
require 'sinatra/reloader'
require 'sinatra/activerecord'
require './models/post.rb'
require 'appsignal/integrations/sinatra'

class App < Sinatra::Base
  ...

  get '/' do
    posts = Post.all

    # set a gauge custom metric
    posts_count = posts.count
    Appsignal.set_gauge("all_posts", posts_count)

    posts.to_json
  end
...
In the code shown above, we use the Appsignal::Helpers::Metrics module and call the set_gauge method, which accepts three arguments:
-
key: the name of the custom metric. In the example, this would be all_posts. -
value- The metric or "thing" to be measured. In the example shown above, this is simply the total post count. -
tags- Additional and optional metadata that can be added to a custom metric and are useful for labeling the data being measured however you want. For example, we could easily tag theposts_countmetric to account for the environment, as shown below:
# app.rb

...

get '/' do
  posts = Post.all
  posts_count = posts.count
  Appsignal.set_gauge("all_posts", posts_count, environment: "development")

  posts.to_json
end

...
Great, we've just added our first custom gauge metric! But if you were to go back to AppSignal, your new custom metric will not be visible. Instead, you're likely to see the default dashboard, as shown below:

So what do you need to do to make the custom metric appear? You need to add a dashboard. Start with creating a new dashboard:

Then name your new dashboard with a descriptive title and description:

With the custom dashboard added, you'll now need to add a graph for the custom metric:

Then define the new graph:

Here's a breakdown of the fields to set up the new graph:
- a. Title - Enter a descriptive title for the new graph.
- b. Description - This is optional, but you can enter a description for the new graph.
-
c. Metrics - Here is where you define the metric that will be measured and displayed by the new graph. This is the name of the custom metric, or the first argument defined in the
set_gaugemethod:all_posts. In this section, you can also define tags (for example, the tag environment is also included as shown). - d. Graph display - This is where you choose the type of graph display for your new graph.
- e. Legend label - You can customize the label for the chart legend here.
- f. Data format - Define the data type used for the graph display. You can choose from a number of formats, including number, percentage, throughput (in requests/minute or hour), duration (in milliseconds), or file size (in bytes).
Once you've properly defined the new graph's properties, you should get a graph for the custom metric. This is similar to what is shown below:

Moving forward, let's look at the next custom metric type: the counter.
The Counter Custom Metric
A counter custom metric is great for measuring how many times an event occurs. Using the example application, we can apply a counter metric to measure every time the home (root) page is visited.
To begin with, edit the root method to include the code shown below:
# app.rb
...
get '/' do
  ...
  Appsignal.increment_counter("visits_count", 1)
end
...
Here, we use AppSignal's increment_counter method and pass it visits_count as the first argument. The increment step is the integer 1, passed as the second argument. You could also add a tags hash as the third argument, but we'll leave it as is (since this was covered in the previous section).
Now go ahead and follow the steps as outlined for the gauge metric type. Add a custom graph for this counter metric to give you a similar graph to the one shown:

Let's switch gears to the distribution custom metric.
The Distribution Custom Metric
The AppSignal distribution custom metric is useful for measuring something per unit of time: for example, how many seconds it takes to generate a PDF report, or how long a background job takes to execute.
Using the example application, let's modify the main file to include a call to an open API endpoint. Then, we'll use a custom distribution to measure how long the API call takes in milliseconds.
# app.rb
...

require 'httparty'

class App < Sinatra::Base
  ...

  Thread.new do
    while true do
      start_time = Time.now
      url = 'https://openlibrary.org/search/authors.json?q=clavell'
      $response = HTTParty.get(url)
      duration = (Time.now - start_time) * 1000
      Appsignal.add_distribution_value("fetch_books_duration", duration)
    end
  end

  get '/' do
    ...
    $response.to_json
  end

  ...
end
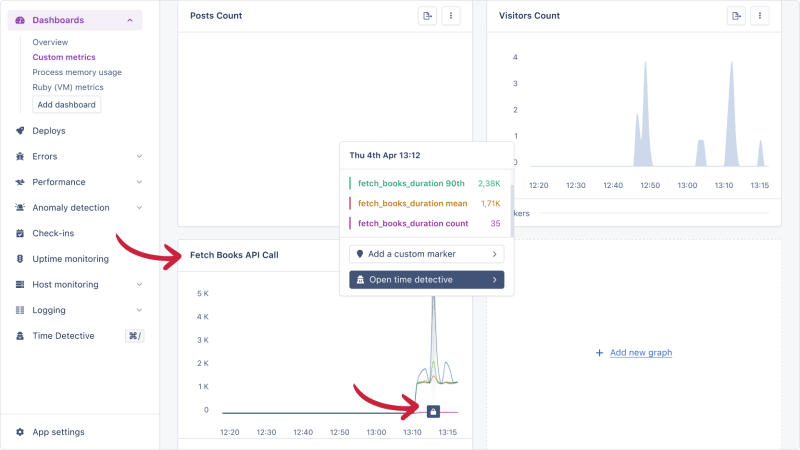
Now, if we go back to AppSignal, we can view the custom distribution as a graph.
Tip: You can follow the steps outlined in the gauge section to set up the custom graph visualization.
Now that you've learned how to create custom metrics and the accompanying graph visualizations, you might have noticed that it's not very convenient to keep going back to the AppSignal dashboards to see what's going on with your app. Instead, it would be very handy if you could get a notification for your custom metrics, right?
Let's learn how to set up notifications for your custom metrics next.
Notification Alerts
By default, whenever an error or performance event occurs, AppSignal will open an incident for that event and place it in the relevant section. For example, if it's an error, you'll find it in the errors list, while performance incidents will be in the performance list.
Additionally, AppSignal sends out incident notifications via email (the default notification channel). You can also set up other notification channels, such as:
- Discord
- Google Hangouts
- Intercom
- Microsoft Teams
- Slack
- Webhook
And more.
But before we set up a notification trigger for one of our custom metrics, it's important to be aware of the various notification options available to you.
To begin with, you can set up a notification for:
- Every time - Here, a notification will be sent out every time an incident occurs.
- First deploy - This indicates that a notification will be sent the first time an incident occurs after a deployment.
- First after close - Here, a notification is sent out whenever an incident re-occurs after the previous one was closed.
- Never notify - As the name suggests, in this case, a notification will never be sent, but the error or performance incident will still be tracked on AppSignal.
- Every nth hour or day - With this option, you can specify how many alerts will be sent to you within an hour or a day. This option is perfect for keeping a balance between getting notified of important events and having too many notifications (which could easily overwhelm you or your team).
I highly suggest you dig into AppSignal's notification settings documentation to get more information on these options.
Let's see how to set up a notification for one of the custom metrics we made earlier. This will be a trivial example, but it will illustrate the steps you need to go through for your own use case.
Setting Up Notification Alerts for Your Custom Metrics
For this example, we'll use the distribution metric that measured the API call's duration earlier in this post. Let's say we'd like to get an email alert whenever the mean duration exceeds a certain number (in milliseconds).
The steps for setting this up are shown below:

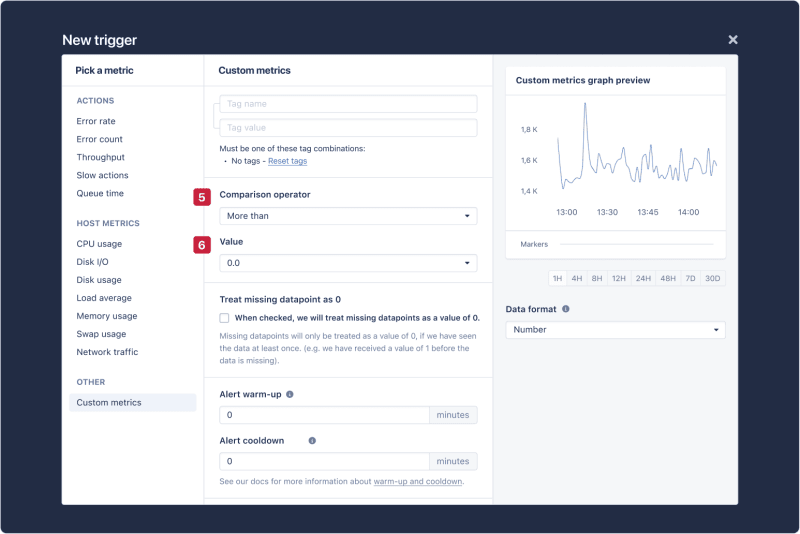
Firstly, begin by hitting the Triggers link in the left-hand menu.

Give your trigger a relevant name, then select the measurement for which this notification is intended. In this example, we are using the fetch_books_duration distribution custom metric. You can also add tags if you wish to.
Next, define the comparison operator and the value to check for. For example, let's say we want to receive an alert whenever the duration exceeds 1600 milliseconds. For this, we would select the comparison operator more than, then, a value of 1600.
Finally, you'll need to define the alert warm-up and cooldown settings. Provide a description for the alert, a link to the dashboard to be included in the alert message (if needed), and, finally, the notification method (with email being the default).
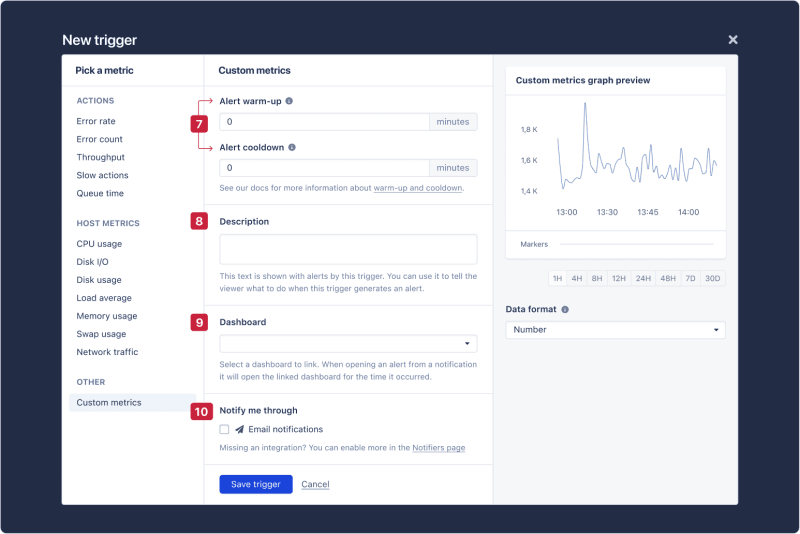
With that done, you'll receive a notification whenever an incident occurs matching the settings you input here.
And that's it!
Wrapping Up
In this article, we learned how to set up custom metrics for a Ruby application with matching dashboards and graph visualizations on AppSignal.
The custom metrics functionality that AppSignal offers can be fine-tuned for very powerful applications. Take a deep dive into AppSignal's custom metrics documentation to discover more possibilities.
Until next time, happy coding!
P.S. If you'd like to read Ruby Magic posts as soon as they get off the press, subscribe to our Ruby Magic newsletter and never miss a single post!


Top comments (0)