Since the launch of uptime monitoring, we have received a lot of positive feedback. There were also a couple of much-requested additional features that we hope to address in this huge update.
Configurable Regions for Uptime Monitoring
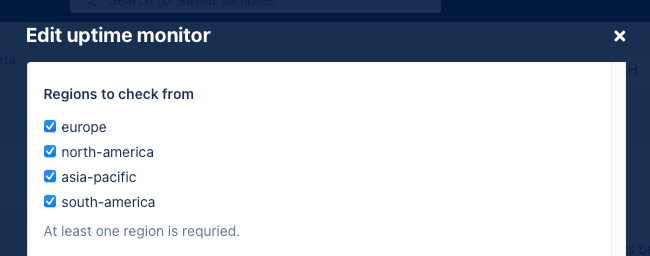
We started uptime monitoring from a few regions: Asia, North America, South America and Europe. But not every app has to be monitored from all regions. It doesn't really matter if performance is poor from South America for a Europe-centric app, for example.
That's why we're introducing an option to select the regions where you'd like to monitor your app:
Public Uptime Status Pages
The most requested feature was to somehow expose uptime monitoring metrics as public status pages.
Starting today, it's now possible to create public status pages for your uptime monitoring metrics:
You're able to select multiple uptime monitors across your organization to show your uptime on this status page:
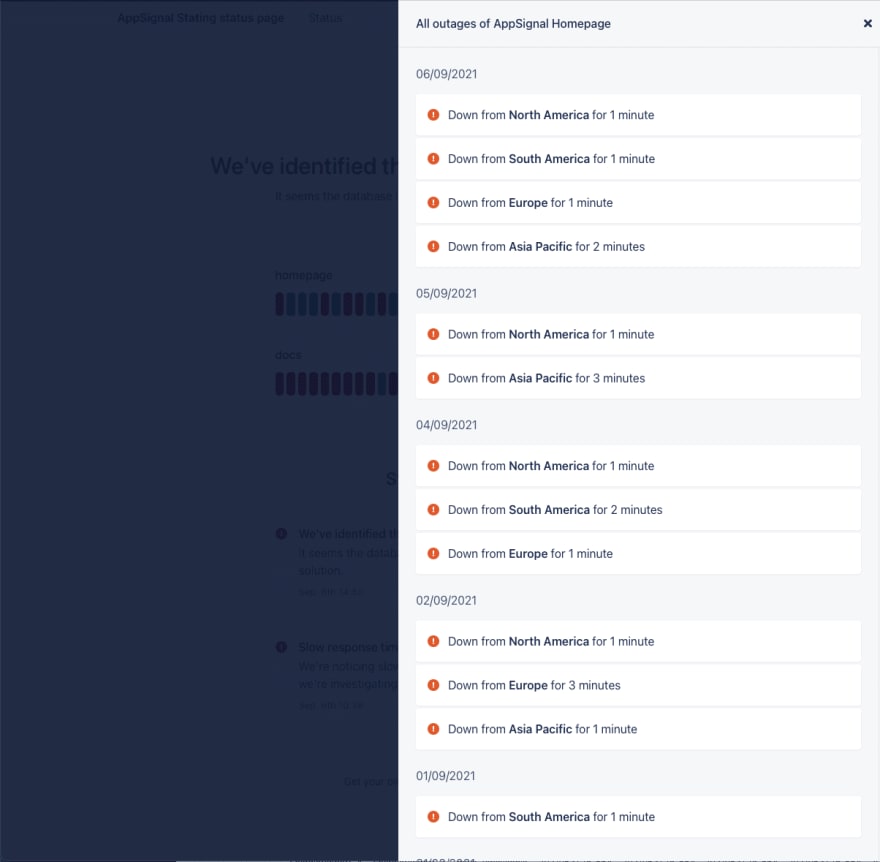
These uptime monitors will be shown on the public status page, where customers can click to see specific details about each monitor:
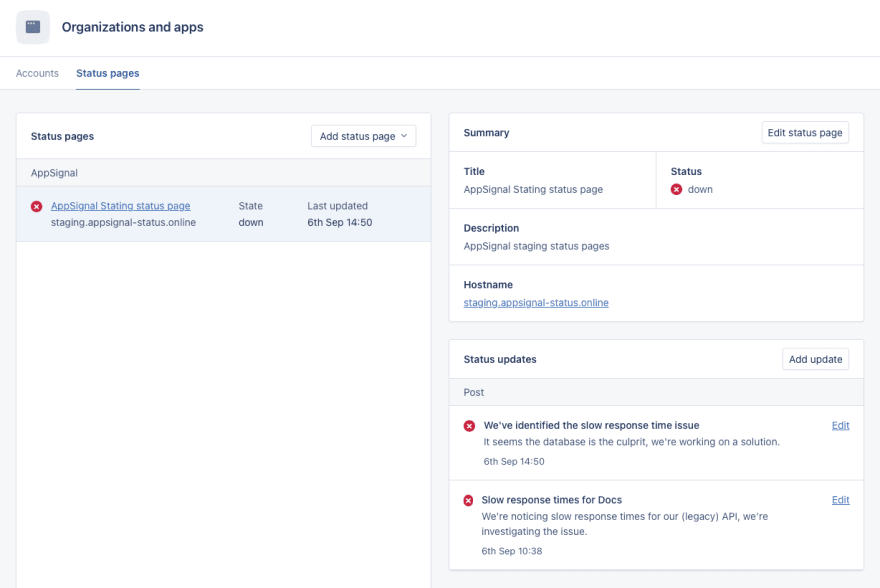
You can also post updates to this status page to let your customers know about any issues. The state of the page is determined by these updates, so you have full control over the status:
Future Uptime Monitoring Features
Right now, status pages will run on a customizable subdomain of our appsignal-status.com domain (e.g. <yourcompany>.appsignal-status.com). We're planning to release custom domains in the near future.
Do you have any other ideas for public status pages? Don't hesitate to let us know.
Uptime Monitoring Sprinkled with Stroopwafels
If you haven't had the chance to test AppSignal and uptime monitoring, here's what you need to know:
- Uptime monitoring is included alongside all of our features.
- We have a free trial option that doesn't require a credit card.
- AppSignal supports Node.js, Ruby, and Elixir projects.
- We're free for open source & for good projects.
- We ship stroopwafels to our trial users on request.
Need we say more? 🍪


Top comments (0)