Instrumentation is an essential part of monitoring and operating an application, especially for apps heavily used in production. Even in today's everchanging technology landscape, visibility and observability still challenge developers and system administrators.
Metrics and logging are essential for monitoring and operating an application. Metrics measure an application's performance and system health, while logging records system health and application state. Instrumentation allows us to collect metrics and log events about an application's state and system health.
Thanks to instrumentation, you can gain great insights into your Elixir application.
In this tutorial, we will cover the importance of instrumentation, go over the basic concepts, and show you how to instrument your Elixir application with AppSignal.
Let's get started!
Why Instrument Your Elixir Application?
Application performance monitoring (APM) is the process of monitoring and keeping track of an application's performance. Many monitoring tools offer APM; in this article, we will focus on AppSignal.
Out of the box, AppSignal will handle error tracking, performance monitoring, and host metrics. However, to get the most out of AppSignal, we need to instrument our application to collect metrics and log events of specific interest to us.
With custom instrumentation, you can mark specific parts of an application to collect metrics and data, gaining insight into the deep inner workings of the application.
For example, we can use instrumentation to collect metrics about:
- a specific function's performance
- the number of times a particular function is called
- the performance of a specific database query
- the number of times a particular database query is called
With this information, developers can identify bottlenecks and refactor code to improve an application's performance.
Normally APM tools will not go deep into the layers of an application to collect metrics. Instead, they will collect metrics at the application level, such as the number of requests per second, the number of errors, and the average response time.
But as we've discussed, custom instrumentation allows developers to manually go deep into an application's layers to collect metrics and log particular events.
Application performance monitoring and custom instrumentation are essential for monitoring and operating an application and should be considered complementary tools.
Pre-requisites
To follow along with this article, you will need to have the following installed:
- Elixir 1.10 or higher
- PostgreSQL 12 or higher
- Docker and Docker Compose v2 or higher
Start by cloning the RealWorld Phoenix application:
git clone https://github.com/tamanugi/realworld-phoenix.git
To get started, we need to install the dependencies and set up the database:
# Start Database
$ docker-compose up -d

# Install dependencies
$ mix deps.get

# Create and migrate your database
$ mix ecto.setup

# Start Phoenix endpoint with `mix phx.server`
$ mix phx.server
Validate that everything works by visiting localhost:4000/api/articles from your browser. You should be able to see the following JSON response:
{
    "articles": [
        {
            "author": {
                "bio": null,
                "following": null,
                "image": null,
                "username": "username"
            },
            "body": "It takes a Jacobian",
            "createdAt": "2022-11-06T17:43:38.000Z",
            "description": "Ever wonder how?",
            "favorited": null,
            "favoritesCount": 0,
            "slug": "how-to-train-your-dragon-1",
            "tagList": [
                "dragons",
                "training"
            ],
            "title": "How to train your dragon 1",
            "updatedAt": "2022-11-06T17:43:38.000Z"
        },
...
    ],
    "articlesCount": 10
}
Next, sign up for a free trial of AppSignal.
Once you have an AppSignal account, attach the AppSignal Elixir package to your application by adding the following to your mix.exs file:
# mix.exs
def deps do
  [
      {:appsignal_phoenix, "~> 2.0"}
  ]
end
Make sure you install the dependency by running mix deps.get.
Next, configure AppSignal by running the following mix command:
mix appsignal.install YOUR_PUSH_API_KEY
Note: YOUR_PUSH_API_KEY is the Push API Key for your AppSignal account. You can find your Push API Key in your AppSignal account under Settings > API Keys.
Follow the automated installation instructions and make sure you use the defaults. Then take one more step to capture the Phoenix HTTP requests. Open the endpoint.ex file and add Appsignal.Phoenix to the list of modules:
  # lib/realworld_phoenix_web/endpoint.ex
defmodule AppsignalPhoenixExampleWeb.Endpoint do
  use Phoenix.Endpoint, otp_app: :appsignal_phoenix_example
  use Appsignal.Phoenix

  # ...
end
Start the application again with mix phx.server, and make a couple of requests to the application by visiting localhost:4000/api/articles from your browser.
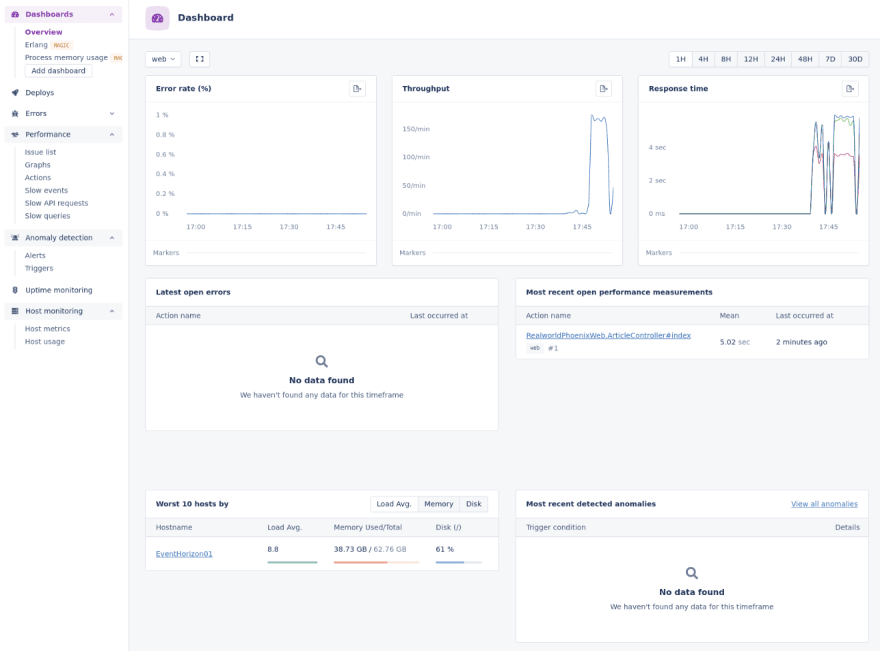
If the setup is successful, you should be able to see the requests in your AppSignal dashboard:
Here, we can see:
- the number of requests per second
- the number of errors
- the average response time
As well as the default metrics, we can also see some custom metrics. Let's add custom metrics in the next section.
Custom Instrumentation for Your Elixir App
Now that we have AppSignal set up, let's implement some custom instrumentation. For this example, we will instrument the lib/realworld_phoenix_web/controllers/article_controller.ex/index/0 function to collect metrics on the number of times the function is called and the average response time.
Key Instrumentation Concepts
Before we proceed any further, let's quickly go over some key concepts:
- Instrumentation is the process of adding observability code to our application. This code will collect metrics and log events of specific interest to us.
- Trace: The record of the paths taken by a single request through the application. Tracing makes debugging less daunting by breaking down a request as the application processes it.
- Span: Spans are the building blocks of traces, representing a single unit of work or operation within a system.
There are two ways to instrument our application. The first uses helper functions, and the second uses function decorators. We'll review both approaches, starting with the helper function approach.
Instrumentation Using Helper Functions for Your Elixir App
Using decorators to add custom instrumentation is relatively easy. However, there are cases where we might need more flexibility with instrumentation — for example, when we want to trace specific parts of a function.
Using the index/2 function as an example, we can use helper functions to add custom instrumentation. Open the lib/realworld_phoenix_web/controllers/article_controller.ex file and update the code to look like this:
# lib/realworld_phoenix_web/controllers/article_controller.ex
def index(conn, params) do
  # Add a delay to the function
  slow()

  keywords =  Appsignal.instrument("keywords_map", fn ->
    for {key, val} <- params, do: {String.to_atom(key), val}
  end)

  keywords = Appsignal.instrument("keywords", fn ->

      case Guardian.Plug.current_resource(conn) do
          nil -> keywords
          user -> keywords |> Keyword.put(:user, user)
      end
  end)

  articles = Appsignal.instrument("articles", fn ->
      Articles.list_articles(keywords)
      |> Articles.article_preload()
  end)

  render(conn, "index.json", articles: articles)
end
Using the Appsignal.instrument/2 function, we can wrap specific parts of the code and add events to the span. This allows us to break down the transaction into smaller parts and see where an application is spending most of its time.
Appsignal.instrument/2 allows us to instrument a function, taking three parameters:
- name of the function
- category (this can be left empty)
- the function we are trying to instrument itself
Instrumenting Your Elixir App with the Function Decorator
The main advantage of function decorators is that we can instrument our application without modifying the code. For this app, we can use Appsignal.Instrumentation.Decorators.
Open the lib/realworld_phoenix_web/controllers/article_controller.ex file and add the following to the top of the file:
# lib/realworld_phoenix_web/controllers/article_controller.ex
use Appsignal.Instrumentation.Decorators
Also, to make this example more interesting, let's add a delay to the index/0 function. This will allow us to see the impact of the delay on the response time:
# lib/realworld_phoenix_web/controllers/article_controller.ex
def index(conn, params) do
  # Add a delay to the function
  slow()
  keywords = for {key, val} <- params, do: {String.to_atom(key), val}

  keywords =
    case Guardian.Plug.current_resource(conn) do
      nil -> keywords
      user -> keywords |> Keyword.put(:user, user)
    end

  articles =
    Articles.list_articles(keywords)
    |> Articles.article_preload()

  render(conn, "index.json", articles: articles)
end

# Decorate this function to add custom instrumentation
@decorate transaction_event()
defp slow do
  Enum.random(1000..6000)
  |>:timer.sleep()
end
Now that we have added the decorator, let's make a couple of requests to our application. You can do this by visiting localhost:4000/api/articles from your browser.
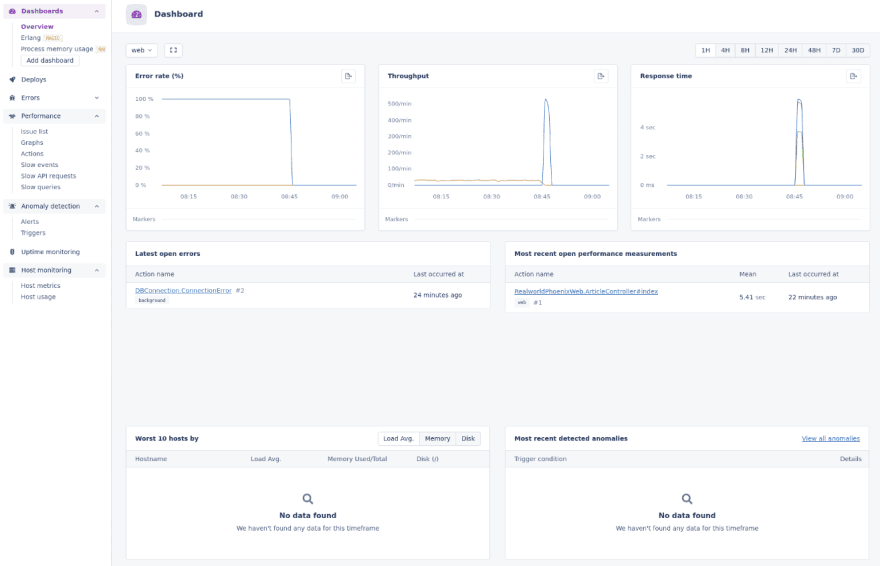
After refreshing the articles a couple of times, you should be able to see the following in your AppSignal dashboard:
We can see that the index/0 function was called and is reporting a mean of 5.1 seconds. If we click on the dashboard, we can check out the transaction details:
Here, there's information about how much time the transaction spent calling the database, parsing the route, etc. Because we added custom instrumentation, we know that the slow/0 function is the bottleneck.
Helper Vs. Decorator Functions
When it comes to choosing between decorators and helper functions, it really depends on your use case. Both approaches have their advantages and disadvantages.
Decorators are great for adding instrumentation to a function without having to modify the code. However, we can't add instrumentation to specific parts of the function and that might limit the amount of information we can gather. Yet, in cases where functions are fairly simple, decorators are a great way to add instrumentation without impacting on code.
Helper functions, on the other hand, allow us to add instrumentation to specific parts of a function. With decorators, we can only add instrumentation to an entire function. But with helpers, we can add another layer of granularity to dig deeper into potential bottlenecks in our application. Going back to our example above, we were able to break down the index/0 function into smaller parts and see where the application was spending most of its time.
However, helper functions require us to modify the code, which might not be ideal in some cases and can add complexity.
Most importantly, consider:
- your use case
- the amount of information you want to gather
- how much granularity you need in your instrumentation.
In most cases, helper functions will be the best approach, as they can add a significant amount of granularity to your trace.
Wrapping Up
In this article, we went over the basics of adding instrumentation to an Elixir application. We learned how instrumentation can help us uncover bottlenecks and improve an application's performance. We also saw how AppSignal can help us aggregate and visualize the data we collect.
With AppSignal, we have a single tool that allows us to collect different data types, and explore the data to look for bottlenecks, issues, and potential correlations between different parts of a system.
Instrumentation is a powerful tool that will help you understand the inner workings of your application. You will be armed with the knowledge to resolve bottlenecks and catch potential issues before they become a problem.
Happy instrumenting!
P.S. If you'd like to read Elixir Alchemy posts as soon as they get off the press, subscribe to our Elixir Alchemy newsletter and never miss a single post!


Top comments (0)