When relying on data from external services, it's important for the retrieval to be accurate and timely. While we may not control how efficiently an external API responds to our requests, we can control how and when we request data from that API. However, over time as your application and the API that serves it change, once efficient requests may turn into bottlenecks.
In this article, we'll demonstrate how you can leverage AppSignal's new Tesla integration to monitor your Elixir application's HTTP client performance and use this data to positively influence its architecture.
Templating with Tesla
Note: To implement what is covered in the post, you will need AppSignal for Elixir 2.7.3 or higher and Tesla 1.4.3 or higher.
Let's imagine you manage an application that ships stroopwafels around the world. To do this, your application connects with a dedicated Stroopwafels courier, Strooperoo, using its API to create, update, and track deliveries, with requests structured as follows:
# Create a new delivery
POST https://strooperoo.com/deliveries/create/

# Update an existing delivery
POST https://strooperoo.com/deliveries/:delivery_id/update

# Retrieve the status of a delivery
GET https://strooperoo.com/deliveries/:delivery_id/status
Let's say you've noticed some issues in your application's performance, especially when retrieving a delivery status. Luckily, you're using AppSignal, so you can investigate this further by checking the application's slow API requests.
Typically, AppSignal will group slow API requests by their base URL. In our case, all of the following requests would be grouped under the base URL https://strooperoo.com/:
https://strooperoo.com/deliveries/create/
https://strooperoo.com/deliveries/1971/update
https://strooperoo.com/deliveries/1971/status
This is useful in deducing that the HTTP client is slow but doesn't help us immediately pinpoint which requests are problematic.
However, with Tesla, AppSignal can group your requests beyond their base URL. This is because Tesla allows you to use URL templates enabling AppSignal to understand how a request was built:
defmodule StrooperooAPI do
  use Tesla

  plug(Tesla.Middleware.Telemetry)
  plug(Tesla.Middleware.PathParams)

  def delivery_status(id) do
    params = [delivery_id: id]

    get(
      "https://strooperoo.com/deliveries/:delivery_id/status",
      opts: [path_params: params]
    )
  end
end
So, in the above example, we know you're making a request to the status endpoint, and can apply the appropriate grouping.
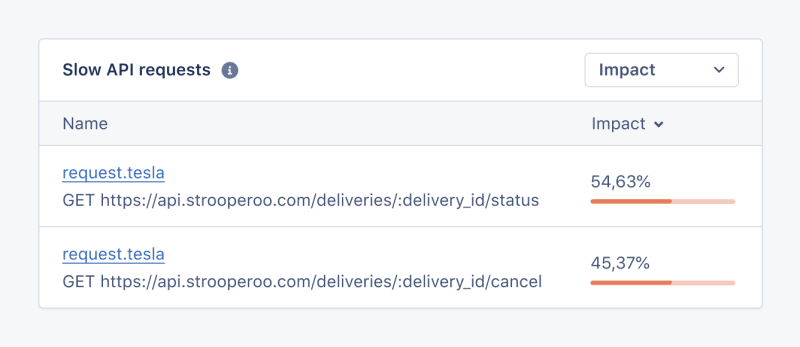
Which means that in AppSignal, instead of seeing slow API requests grouped like this:
You'll see requests grouped accurately like this:
Tesla makes your HTTP client monitoring data way more valuable as you can now quickly deduce how your application's HTTP client is performing on a request level.
Wait a Minute, Why Can’t You Do This with Other HTTP Clients!?
Good question. That's because Tesla's templating lets us understand how your request is built. With other HTTP clients, we get a URL string such as:
https://api.wow.com/api/versions/4/users/14383/comments/page/1
It's very tricky to understand, just from a string, what this request is doing and which elements of the request are parameters. Tesla's templating removes that guesswork for us and allows us to accurately group requests by telling us exactly what parameters are in the request URL. Neat, right?
Solving Slow Requests
Looking at our slow API requests, we can now see that requests to /status perform poorly. So let's investigate the application's delivery_status logic.
def delivery_status do
  deliveries = Repo.all(Delivery)

  Enum.each(deliveries, fn delivery ->
    StrooperooAPI.delivery_status(delivery.id)
  end)

  conn
  |> put_flash(:info, "Delivery status updated")
  |> redirect(to: "/deliveries")
end
Here, we are making many requests synchronously. When we first created the application, we were only managing a small number of deliveries, so we didn't experience any issues. But now, we're managing thousands of deliveries. This means that thousands of synchronous requests are being made every single time someone presses the "sync" button in the application.
One way we can better handle this is by running the code asynchronously in a scheduled background job using Oban:
defmodule DeliveryStatusJob do
  use Oban.Job

  @impl true
  def perform(_job, _) do
    deliveries = Repo.all(Delivery)

    Enum.each(deliveries, fn delivery ->
      StrooperooAPI.delivery_status(delivery.id)
    end)
  end
end
AppSignal supports Oban monitoring, so we'll be able to monitor the performance of our Oban job too!
More than Just Monitoring
This is just one of many examples of how monitoring your application with AppSignal can help you make data-driven decisions, in this case, thanks to Tesla's unique templating functionality. You can learn more about utilizing your Tesla HTTP client with AppSignal in our Tesla documentation.
AppSignal's slow API request monitoring is just one of our many developer-driven features that help you get the most out of monitoring your application. Developers also enjoy using our monitoring because we have:
- An intuitive interface that is easy to navigate.
- Simple and predictable pricing.
- Developer-to-developer support.
If you experience any issues when using AppSignal for Elixir or Tesla, our support team is on hand to help! And remember, if you're new to AppSignal, we'll welcome you onboard with an exceptionally delicious shipment of stroopwafels 🍪 😋


Top comments (0)