
We're excited to announce AppSignal support for Vector logs and metrics!
AppSignal's Vector support allows you to expand your monitoring horizons beyond our standard language integrations, making it possible to leverage AppSignal to both monitor the performance and manage the logs of components of your stack that fall outside a standard application.
With Vector, you can use AppSignal to monitor how your databases and Kubernetes clusters perform and metrics from many other sources.
Automatic Dashboards for PostgreSQL and MongoDB
AppSignal's Automated Dashboards take the guesswork out of monitoring, giving you instant performance insights into core metrics.
We currently offer out-of-the-box Vector support for PostgreSQL and MongoDB Automated Dashboards.
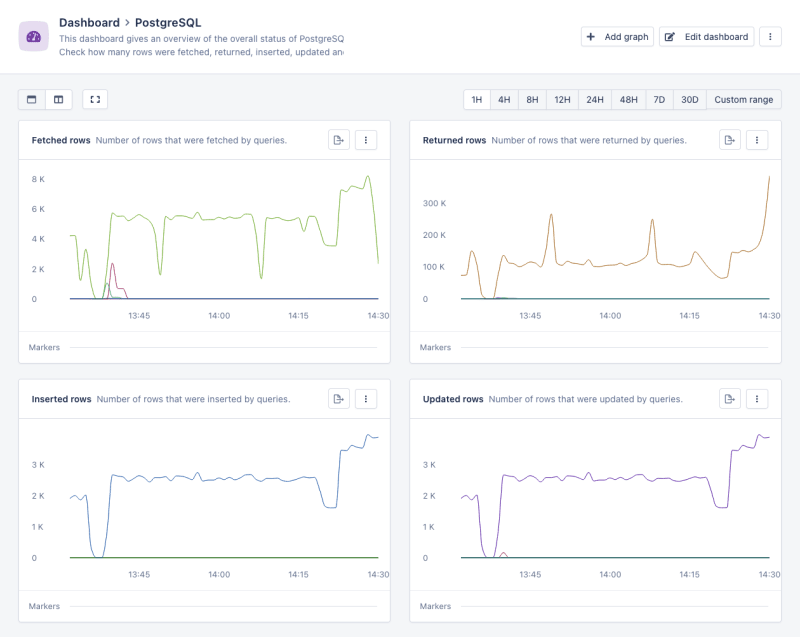
Our PostgreSQL and MongoDB dashboards give you deep performance insights, helping you answer important performance questions at a glance, like:
PostgreSQL
- What is the count of each query type:
SELECT,INSERT,UPDATE,DELETE,COMMIT, andROLLBACK? - How many queries were rolled back?
- How many deadlocks occurred?
- How many database clients are connected?
- How many temporary files have been written to disk for queries?
MongoDB
- What's the health of the databases? (memory usage, network usage, number of operations, open connections with clients)
- How is the database performing? (number of bytes read and written, cache size, number of in-progress transactions)
- Is database replication delayed? (network usage, buffer size, number of operations)
You can learn more about PostgreSQL and MongoDB Automated Dashboards in our Vector documentation.
Supported Vector Source Metrics
You can also create graphs and dashboards with Vector's sources. AppSignal currently supports metrics from the following sources:
| Source | Source Name |
|---|---|
| Amazon Elastic Container Service | aws_ecs_metrics |
| Apache HTTPD Server | apache_metrics |
| EventStoreDB | eventstoredb_metrics |
| MongoDB | mongodb_metrics |
| NGINX | nginx_metrics |
| PostgreSQL | postgresql_metrics |
| Vector host metrics | host_metrics |
| Vector internal metrics | internal_metrics |
You can also use Vector Remap Language to convert logs to metrics. Allowing you to extract and track valuable metrics like error type or user login count directly from your app's logs!
Getting Started with AppSignal and Vector
AppSignal makes monitoring your Vector sources a breeze.
Just make sure you're using Vector version 0.33.0 or higher, as older versions do not come with the sink required to send your monitoring data to AppSignal.
Sending Logs to AppSignal with Vector
You can use Vector to send logs from Vector sources like Docker or Kubernetes to AppSignal.
- First, you need to add a new log source to your app in AppSignal.
- Once you've created a new log source, configure Vector to send logs to AppSignal, for example:
# vector.toml config file example
[sources.my_kubernetes_logs_source]
type = "kubernetes_logs"

[sinks.appsignal]
type = "appsignal"
inputs = ["my_kubernetes_logs_source"]
push_api_key = "Your app-level Push API key"
Please note: Some Vector sources may require additional configuration; this will be outlined in the Vector's Source documentation.
Sending Metrics to AppSignal with Vector
To start sending Vector source metrics to AppSignal, you'll have to configure Vector to report metrics from your chosen source. For example, to send Apache HTTPD server metrics you'd write the following configuration:
# vector.toml config file example
[sources.my_apache_metrics_source]
type = "apache_metrics"
endpoints = ["http://localhost:8080/server-status/?auto"]

[sinks.appsignal]
type = "appsignal"
inputs = ["my_apache_metrics_source"]
push_api_key = "Your app-level Push API key"
To track custom metrics from a source like StatsD:
# vector.toml config file example
[sources.my_statsd_source]
type = "statsd"
address = "0.0.0.0:9000"
mode = "tcp"
path = "/path/to/socket"

[sinks.appsignal]
type = "appsignal"
inputs = ["my_statsd_source"]
push_api_key = "Your app-level Push API key"
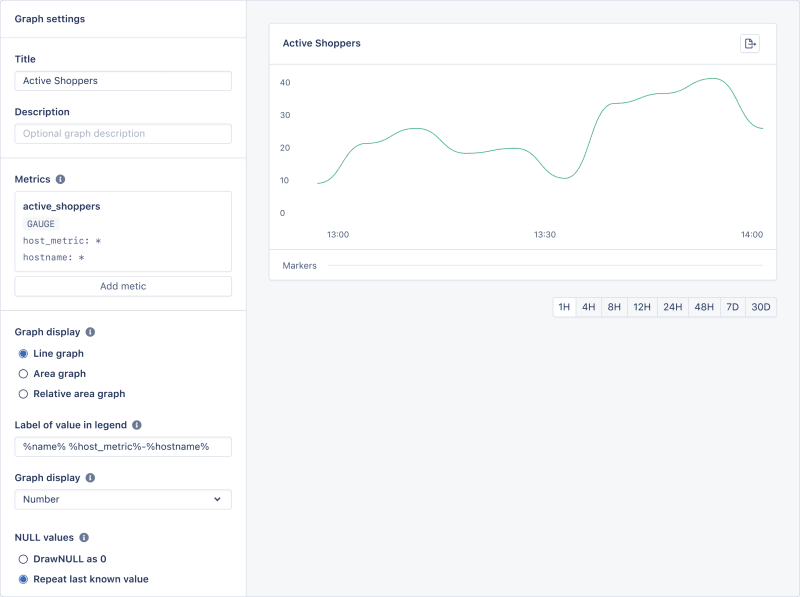
Tracking metrics with AppSignal
You can track all of the Vector source metrics you send to AppSignal via Custom graphs. Simply create or navigate to an existing dashboard and select Add graph; you can then create a line, area, or relative graph:
Managing Logs with AppSignal
AppSignal's Log Management allows you to manage your vector source logs easily.
Gain deep insights into your code's performance by combining your APM and log management.
With AppSignal's intuitive UI, you can navigate from an error message to a log line in just a few clicks and query, filter, and share logs effortlessly.
Detecting Anomalies with AppSignal
Anomaly detection lets you define the boundaries of what you consider to be good performance in your application and notifies you when and where metrics go over their limits.
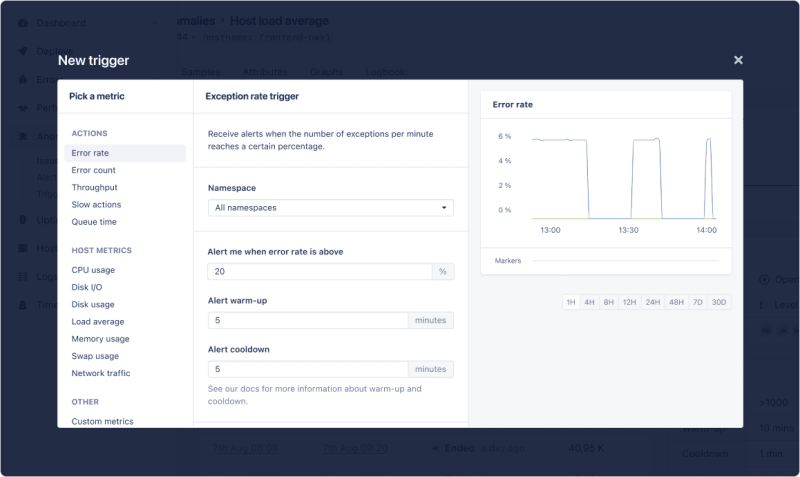
For example, you can create custom triggers to alert you if your MongoDB memory metric increases by a certain amount within a specific timeframe, giving you the time to solve problems before they become performance bottlenecks.
Ready to Power-up Your Performance Insights?
Once you've configured Vector to send source metrics and logs to AppSignal, you should be able to begin inspecting log lines and visualizing performance in a matter of minutes.
You can start with Vector by following the Vector configuration documentation!
AppSignal, The Awesome APM
AppSignal is built by developers for developers to give you the visibility and insights needed to manage and scale your application effectively. As well as Vector support AppSignal offers:
- A 360-degree view of your application data.
- An intuitive interface that's easy to navigate.
- A clean approach to connecting errors, logs, and performance incidents.
- The ability to monitor your Node.js, front-end JavaScript, Ruby, Elixir, and Python applications in one place.
If you're a new trial user, reach out to us once you've got your application set up with AppSignal, and we'll send a package of stroopwaffles to you 🍪!

Top comments (0)