
MongoDB Atlas is a comprehensive platform for building data driven applications. While most people know Mongo for their document style database, the capabilities of their cloud platform can empower both individual developers and teams to do great things - fast. When you spin up an Atlas cluster, you have search, charting, and data archiving built in. Today, I'll be walking through getting started with MongoDB's serverless solution - Realm
Realm originally was an open source, object database oriented towards the mobile market and developer experience. They made it easy to sync data between clients(phones and tablets) and a central database. However, today it is a platform that:
builds better apps faster with edge-to-cloud sync and fully managed backend services including triggers, functions, and GraphQL.
The fact that Realm sits right on top of your database means you can easily stand up an API with authentication in minutes. It automates many parts of creating an API, - it creates the GraphQL schema, runs a validation, and helps you craft your queries through custom resolvers and mutations.
Beyond just GraphQL, Realm can also host a single page application or static sites, run serverless functions, and perform magic with Sync. If you do it right, your entire stack can be on Atlas. We're going to create a web app to do just that.
I really like the idea of visualizing data on a map. While I made a tutorial about doing this in Python, I love creating things for the web. Everyone is always app this, app that, but this limits your audience to a single platform - unlike the web. Billions of people have access to an internet browser. Let's build a website that calls our data and visualizes it on a map.
Seems pretty simple, but the second you have your site call a database it can go from some fun project to teeth grinding code writing, where you forgot why you were even doing this in the first place. I think keeping the fire alive is what can take a project from some weeknight thing to a passion project you continue to iterate on.
If you are interested in seeing me upload crime data to a MongoDB collection, I am happy to walk through that - just let me know. However, for this project, we will be using the sample data that comes with MongoDB. If you have done a MongoDB tutorial you will be beyond familiar with these sample collections.
The sample database we are going to use is called sample_geospatial, which is a collection of 11,000 shipwrecks. MongoDB actually allows you to do GeoSpatial queries, like $geoNear - which returns an ordered stream of documents based on the proximity to a geospatial point. Real quickly, a MongoDB instance, or cluster, is made up of Databases that contain collections. Unlike SQL, it is document-based, rather than relation-based. The document style is really suitable for information related to web applications. You can load everything you need for a page without joining tables. You just have to architect it right.
Creating The Database 💾
If you haven't yet, go ahead and create a MongoDB account. Besides AWS, the MongoDB free tier is as generous as they come. After creating a project and a database, click [...] - Load Sample Data:

If you now click Browse Collections you will find our geospatial database + the single shipwrecks collection. If we click through to this and see the list of documents, we can get an understanding of the general shape of the document.
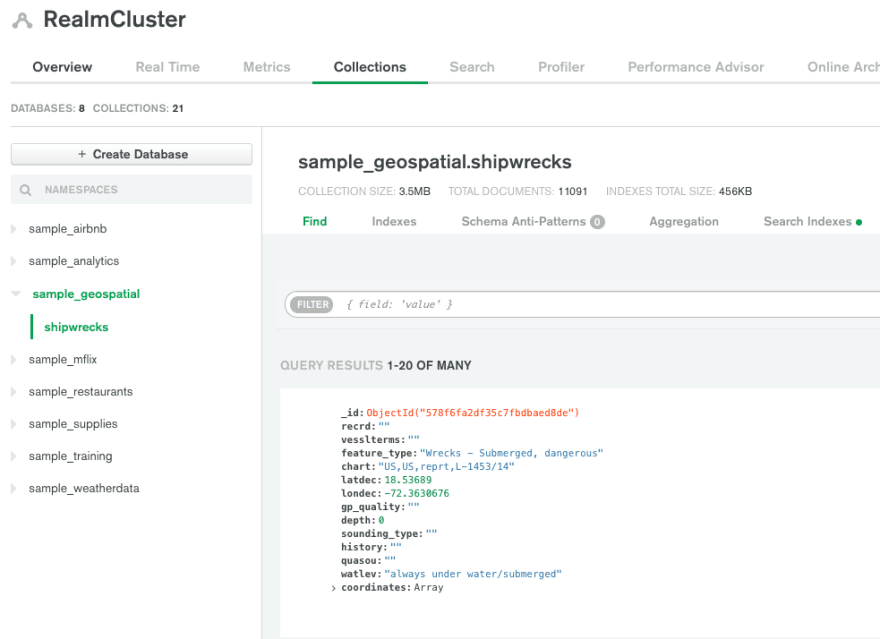
My hunch is we will mainly be focused on longitude and latitude. I recommend clicking through a few pages of documents and get a mental model of what you are seeing. Now that we have looked at our data, let's go ahead and click the Realm Tab at the top of the page. If you haven't created a Realm project before you will see the following dialogue. Name the app whatever your heart desires and navigate to the schema tab.

After clicking this tab, it prompts us to add a Data Source. Make sure to chose your cluster, probably named Cluser0. Now name your Realm project, I am going with data-viz. I am going to leave MongoDB Connection string off for now. Finally chose primary for the Read Preference and click Save Draft.
With Realm, deploying changes is a two-step process. We just drafted our changes - which at the end of the day are just a few line changes in a few config.json files - now we need to deploy them. You will see a blue banner with a button about review and deploying. Click through.
Before we can create a schema based on our data we have to give Realm permission to our shipwrecks collection. Click "+ Add Collection" on the Rules page it just directed you too. Make sure to select the geospatial database and proper collection. If you don't see any databases or collections, your cluster might be performing maintenance. If you go back to the Atlas tab, you can see if your cluster is ready or not.
Once the collection shows up, click Shipwrecks. Ignore the sections about permissions and templates and click Add Collection in the bottom right.
Now if we go back to the schema page we can generate the GraphQL schema. You'll see a green "Generate Schema" button on the right side of the page. Click it.

Make sure to chose just the shipwrecks collection in the first select. Next, you choose how many documents to sample. With GraphQL, the schema validation matters in totality. It feels like an iron first that forces you to get your data structure down. 500 is fine for this. I've found major diminishing marginal returns after around 750.
Click save and deploy. Without saving and deploying, your validation won’t work. When we navigate to the validate tab, and click run, it should pass!
We are off to a great start, though it might feel like we've done nothing - but understanding what the heck is going on will have you feeling more confident when we start coding the frontend.

Click GraphQL in the left-hand menu, and click play in their interactive frame. It should return a single shipwreck. If we remove fields like history and recrd then rerun the document you will see that our response does not include those fields. This is the beauty of GraphQL, we only get back the fields we ask for! Next, if you add an s to shipwreck, or shipwrecks, you will see it returns a list of documents. This is how you query either one or multiple documents in GraphQL.

Frontend
Before we visualize our shipwrecks collection, we need to learn a few things about Vue, Open Street Maps, and how to call our Realm backend.
For simplicity, we are going to define an anonymous authentication method, aka anyone can make a get call. We are going to use Vue Apollo. This is an easy way to integrate GraphQL + reactivity into your Vue app while mostly abstracting away the complexity.
We are also going to use a javascript library to visualize our data. I have found OpenLayers, and more specifically the Vue 3 Flavor, to be super simple to work with.
Now it's time to create the frontend to display our data. Even if you have never coded something in a javascript framework, you could still do this. If I am being honest, I think Vue2 is more beginner-friendly than Vue3. The thing is - Vue2 is a bunch of boilerplate. So much scaffolding but it's easy to organize your code.
Vue3, to me, feels like a mature beast. It is still approachable, but you are losing some of the bowling bumpers that Vue2 had. The tradeoff is there is way less code, and with <script setup> you can make a reactive front end in just a few lines. You are going to see see things like ref() and computed(() => {}). While you can read about these concepts in the docs, using them might be the quickest way to learn why and how these properties are used.
 nicholasoxford
/
realmVueTemplate
nicholasoxford
/
realmVueTemplate
Template for Going Serverless with MongoDB Realm & Vue 3
git clone https://github.com/nicholasoxford/realmVueTemplate.git
cd realmVueTemplate
npm i
npm run dev
Let's start out by downloading my Github repo. It is a starting point that has Apollo, OpenLayers, and Vue3 preconfigured. I will also add a link at the end to a completed repo for you to test out. I highly recommend trying to follow the rest of the tutorial.
The first file we are going to look at is main.js. It is where we mount and configure packages like openLayersMap and Apollo. If you think about it, we want to be able to call our GraphQL data anywhere in the app. To do this we have to globally configure Realm on the client-side and tell Vue our URL.
const id = "test-iuege";
const config = {
  id,
};
const appRealm = new Realm.App(config);// Gets a valid Realm user access token to authenticate requests

// HTTP connection to the API
const httpLink = createHttpLink({
  // You should use an absolute URL here
  uri: 'https://realm.mongodb.com/api/client/v2.0/app/test-iuege/graphql',
  fetch: async (uri, options) => {
    const accessToken = await getValidAccessToken();
    options.headers.Authorization = `Bearer ${accessToken}`;
    return fetch(uri, options);
  },
})

async function getValidAccessToken() {
  // Guarantee that there's a logged in user with a valid access token
  console.log(appRealm)
  if (!appRealm.currentUser) {
    // If no user is logged in, log in an anonymous user. The logged in user will have a valid
    // access token.
    await appRealm.logIn(Realm.Credentials.anonymous());
  } else {
    // An already logged in user's access token might be stale. To guarantee that the token is
    // valid, we refresh the user's custom data which also refreshes their access token.
    await appRealm.currentUser.refreshCustomData();
  }
  return appRealm.currentUser.accessToken
}
Replace const id = "test-iuege"; with your RealmID:

Next click the GraphQL tab in the Mongo UI and copy and paste the URL on the right hand of the page. In the code replace the text of the variable URI with what is in your clipboard.
Finally, click the authentication tab, click the edit button next to Allow users to log in anonymously, and switch it to on. Remember you have to deploy your changes when using Realm. If you look at the main.js again, you see we call appRealm.login() with anonymous credentials. I am sure you could hand-code that, but these packages make it so easy to configure things like this on the client-side.
Before we change any frontend code, let us go ahead run npm run dev in the terminal. If you go to your link, most likely http://localhost:3000/, you will see the standard Vue getting started page. I think it is beneficial to have our app running so we can see the changes in real-time. This is known as Hot Module Reloading, or HMR. One last time, look back main.js and you will see import OpenLayersMap from 'vue3-openlayers'. This allows us to utilize OpenLayers components anywhere in our app.
Looking at Open Layer's Vue 3 Website, we see a list of components we can add to our template. With the fact I want to visualize more than one shipwreck, I chose the ol-geom-multi-point component. Looking at this page, we see the <template> code which highest level component is ol-map. I would recommend clicking the ol-map component page, and exploring the rest of the site. In my opinion, you can learn enough from just ol-geom-multi-point page, but it's helpful to see how other examples utilize the code.
On the site, below the template code, we see the examplescript code section. Because we are going to use the composition API, our final result might look a little different. Let's go ahead and jump back to VsCode (I don't want to hear it) and navigate to /components/HelloWorld.vue. Here you will need to delete or comment out everything in the <template> section.
Next, take everything from OpenLayers and replace what was just removed. Inside our updated <template> code, the component we will worry most about is:
<ol-geom-multi-point/>
In the code you copied over, you will see :coordinates= is equal to an array of long, lat coordinates, or an array of arrays! We are going to set coordinates to a variable later. If you scroll, you will see in the script section I have the code you need commented out. Go ahead and delete or comment the code that is already there. Notice how there is no return statement like there was in the online example. This is beauty of <script setup>... Thank you Evan You!
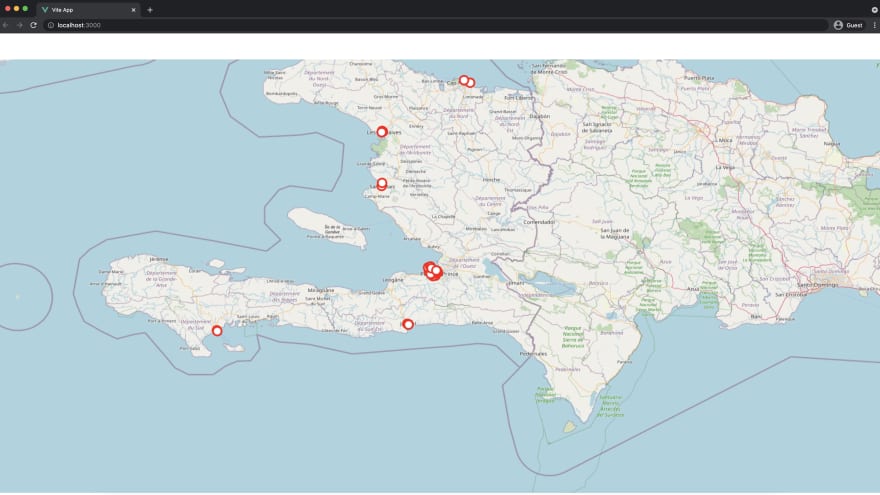
The other difference is that my center variable is different. This is because the online example shows some spots in the middle of china, about as far as you can get from shipwrecks. I put the center point to Port-au-Prince, which has a bunch of shipwrecks. Maybe in part 2 we could make it where, as we move the map, it queries our database for the closest shipwrecks. This is easy with MongoDB! It supports GeoJSON like PostgreSQL.
Even though I set the center to Haiti, there are no shipwrecks on your screen. We need to call our Realm instance! This couldn't be easier, as we did most of our configuration in main.js. We need to add two things to our import statement:
import gql from "graphql-tag";
import { useQuery, useResult } from "@vue/apollo-composable";
Looking back at the Vue3 Apollo Docs, we can learn all about queries. Hopefully, right now something is clicking, Realm has already automated a gnarly part of GraphQL: creating a query. For our example, we can leave out almost all of the fields, but just copy it from the GraphQL tab!
const { result} = useQuery(gql`
  query AllShips {
    shipwrecks {
      _id
      chart
      coordinates

    }
  }
`);
We could get everything out of that result object, but I recommend using const points = useResult(result). Instead of dealing with iteration, all the info you need is right there. Also, useResult can help with returning errors. Now we need to use a computed property. Computed properties watch for value changes and react to it, furthermore, it caches the result so it can help with performance. In the computed property we are going to map out the coordinates. If you think about it, we are creating an array of arrays.
const messages = computed(() => points.value ? points.value.map(x => x.coordinates) : [[]])
The last thing we need to do is set coordinates to equal our variable messages.
<ol-geom-multi-point :coordinates="messages"></ol-geom-multi-point>
If we click save and navigate back to our browser, we should see the shipwrecks! It is not pretty, but we have achieved two goals. First, we are calling our database and getting data back. After mapping it out, our front end is reacting and plotting it. All with a few lines of code!
In this tutorial we have gone from nothing, to having a website that is visualizing shipwreck data from a database we control. We are using the latest and greatest in Vue, utilizing <script setup>, the composition API, and GraphQL. We also set up authorization, cleaned our data, and validated schemas. In part 2 I can show deploying this app using Realm, and using Realm’s custom resolvers to query data based on Longitude and Latitude.
Just for posterity's sake, here is my <script> section.
<script setup>
import { useQuery, useResult } from "@vue/apollo-composable";
import { computed } from 'vue'
import gql from "graphql-tag";
const { result} = useQuery(gql`
  query AllShips {
    shipwrecks {
      _id
      chart
      coordinates

    }
  }
`);
const points = useResult(result)
const messages = computed(() => points.value ? points.value.map(x => x.coordinates) : [[]])
const center = [-72.333336, 18.533333];
const projection = "EPSG:4326";
const zoom = 9;
const rotation = 0;
const radius = 10;
const strokeWidth = 4;
const strokeColor = "red";
const fillColor = "white";
</script>
What we also can do is increase the "height" value in
<ol-map
    :loadTilesWhileAnimating="true"
    :loadTilesWhileInteracting="true"
    style="height: 1000px"
  >
To clean up, we can go back to App.vue and comment out the <img> element, click save and return to localhost:3000. Looking much better. Vue and Mongo are two products I love building with. It's a great mix of ease of getting off the ground and ability to craft a complex application or website. You can find a few examples of Apple.com using vue!
Let me know if there is anything you specifically want to see in part 2 😎!
Nicholas Oxford


Top comments (1)
I try do this. But browser return failure, because CORS