Apache ShardingSphere follows Database Plus — our community’s guiding development concept for creating a complete data service ecosystem that allows you to transform any database into a distributed database system, and easily enhance it with sharding, elastic scaling, data encryption features & more.
Users often need to monitor Apache ShardingSphere’s performance in a real application scenario to find specific problems.
It’s a given that Application Performance Monitoring (APM) can monitor and diagnose system performance by collecting, storing, and analyzing observable data. It also integrates functions such as performance metrics, tracing analysis, application topology mapping, etc.
It retrieves the observable data from system operations by utilizing Tracing, Metrics and Logging. Apache ShardingSphere provides the Observability function for users.
Purposes
Apache ShardingSphere allows developers to configure logging output. The main objective of the current Observability feature is to provide necessary metrics and tracing data for users.
Design
We chose the common Agent method to perfectly implement Observability, with ByteBuddy (a code generation library that allows developers to modify Java classes (arbitrary included) during application runtime without using a compiler and Java Agent.
We adopt the plugin-oriented design to better support different frameworks or systems with Metrics and Tracing. Accordingly, users are allowed to customize the feature or develop more business-specific components by themselves.
Currently, the Agent module of Apache ShardingSphere supports Prometheus, Zipkin, Jaeger, SkyWalking, and OpenTelemetry.
Example
In the following instance, we deploy Prometheus and Zipkin observable data plugins on Apache ShardingSphere-Proxy to showcase how to use the Apache ShardingSphere Agent module.
Step 1: Install the Required Software
prometheus-2.32.1.linux-amd64.tar.gz(https://prometheus.io/download)
zipkin-server-2.23.9-exec.jar (https://zipkin.io/pages/quickstart.html)
apache-shardingsphere-5.1.0-SNAPSHOT-shardingsphere-proxy-bin.tar.gz
apache-shardingsphere-5.1.0-SNAPSHOT-shardingsphere-agent-bin.tar.gz
MySQL 5.7.34
Step 2: Deploy
Port
Prometheus Server:9090
Zipkin Server:9411
Apache ShardingSphere-Proxy:3307
Apache ShardingSphere Agent(Prometheus Plugin):9000
Prometheus
First, add monitoring objects to Prometheus. In this case, we need to add the Apache ShardingSphere Agent port address 9000 to the Prometheus configuration file prometheus.yml.
vi prometheus.yml
Add the following code under static_configs in the file:
- targets: ["localhost:9000"]
Then, initiate:
./prometheus &
Zipkin
Zipkin is easier to use. Initiate it by input the following command in the Zipkin Server directory:
java -jar Zipkin-server-2.23.9-exec.jar &
Apache ShardingSphere
To deploy Apache ShardingSphere-Proxy and Agent, please refer to the official related user guide.
Assuming Proxy and Agent are both in the /tmp directory, below are the specific Agent deployment steps:
Modify Configurations
Modify the agent.yaml configuration file.
Then, initiate Prometheus and Zipkin plugins and change the Prometheus port data to 9000 in line with the above-mentioned port settings:
applicationName: shardingsphere-agent
ignoredPluginNames:
- Jaeger
- OpenTracing
- OpenTelemetry
- Logging
plugins:
Prometheus:
host:  "localhost"
port: 9000
props:
JVM_INFORMATION_COLLECTOR_ENABLED : "true"
Jaeger:
host: "localhost"
port: 5775
props:
SERVICE_NAME: "shardingsphere-agent"
JAEGER_SAMPLER_TYPE: "const"
JAEGER_SAMPLER_PARAM: "1"
Zipkin:
host: "localhost"
port: 9411
props:
SERVICE_NAME: "shardingsphere-agent"
URL_VERSION: "/api/v2/spans"
SAMPLER_TYPE: "const"
SAMPLER_PARAM: "1"
OpenTracing:
props:
OPENTRACING_TRACER_CLASS_NAME: "org.apache.skywalking.apm.toolkit.opentracing.SkywalkingTracer"
OpenTelemetry:
props:
otel.resource.attributes: "service.name=shardingsphere-agent"
otel.traces.exporter: "zipkin"
Logging:
props:
LEVEL: "INFO"
Add to Start Command
Modify the file /tmp/apache-shardingsphere-5.1.0-shardingsphere-proxy-bin/bin/start.sh and add the absolute path of Agent’s shardingsphere-agent.jar to the startup script.
Before
nohup java ${JAVA_OPTS} ${JAVA_MEM_OPTS} \
-classpath ${CLASS_PATH}**** ${MAIN_CLASS} >> ${STDOUT_FILE} 2>&1 &
After
nohup java ${JAVA_OPTS} ${JAVA_MEM_OPTS} \
-javaagent:/tmp/apache-shardingsphere-5.1.0-shardingsphere-agent-bin/shardingsphere-agent.jar \
-classpath ${CLASS_PATH} ${MAIN_CLASS} >> ${STDOUT_FILE} 2>&1 &
Initiate
Now we’re ready to initiate them under the Proxy directory:
bin/start.sh
Step 3: Test Accesses
Metrics and Tracing Data
We use config-sharding.yaml, the default sharding configuration scenario provided by Apache ShardingSphere-Proxy, to test access and display data.
- Connect to the initiated ShardingSphere-Proxy with MySQL command lines.

Examine the data results in Prometheus Server and Zipkin Server
Queryproxy_infoand get the data results through Prometheus Web.

View Zipkin Web tracing information after connecting to the MySQL client:

Query data through MySQL command line:

Examine the data results of Prometheus Server and Zipkin Server
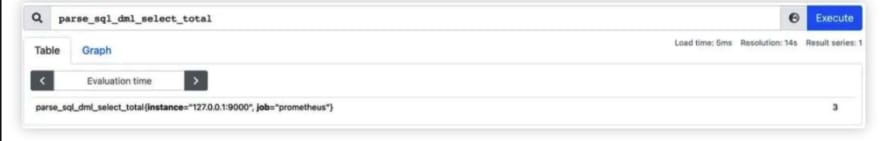
Queryparse_sql_dml_select_totaldata results through Prometheus Web.
Query tracing information via Zipkin Web:

Through a careful search of Span, we can check the tracing status of SQL statement select * from t_order.

Topology Mapping
We cannot find topology mappings when we check dependencies through Zipkin Web.
So, we need to configure them:
Download files
First, download the following Zipkin dependencies, and copy them to the lib directory of Proxy.
Modify Configurations
Configure the data source configuration file config-sharding.yaml, which is in the conf directory of the Proxy, and add the following configuration to the URL corresponding to the lower data source of the config-sharding.YAML dataSources node:
MySQL 5.x:statementInterceptors=brave.mysql.TracingStatementInterceptor
Or MySQL 8.x:queryInterceptors=brave.mysql8.TracingQueryInterceptor
- Restart ShardingSphere-Proxy After performing the same access test as before, we can view dependencies through Zipkin Web and see the following topology mappings:

Sampling Rate
The Observability plugin also enables users to set differnt sampling rate configured to suit different scenarios. Zipkin plugins support various sampling rate type configurations including const, counting, rate limiting, and boundary.
For scenarios with a high volume of requests, we suggest you to choose the boundary type and configure it with the appropriate sampling rate to reduce the collect volume of tracing data.
Zipkin:
host: "localhost"
port: 9411
props:
SERVICE_NAME: "shardingsphere-agent"
URL_VERSION: "/api/v2/spans"
SAMPLER_TYPE: "boundary"
SAMPLER_PARAM: "0.001"
Summary
With the Observability plugin compatible with many common monitoring frameworks and systems by default, users can easily monitor and manage Apache ShardingSphere.
In the future, we will continue to enhance the monitoring capability.
Apache ShardingSphere Open Source Project Links:
Co-Authors

Pingchuan JIANG
SphereEx Senior Middleware Engineer, Apache Tomcat & Apache ShardingSphere Contributor.
An open source technology enthusiast, Pingchuan devotes himself to developing SphereEx-Console and SphereEx-Boot.

Maolin JIANG
SphereEx Senior Middleware Engineer & Apache ShardingSphere Contributor.


Top comments (0)