
A timeline chart is an excellent way to represent important events and periods in chronological order. Now, let me teach you how to easily create an elegant interactive visualization like that using JavaScript!
To make this tutorial both helpful and entertaining, I decided to take real data. Join me as I visualize the life of Elon Musk in a JS timeline chart step by step, focusing on the most important events in his career as an entrepreneur and investor.
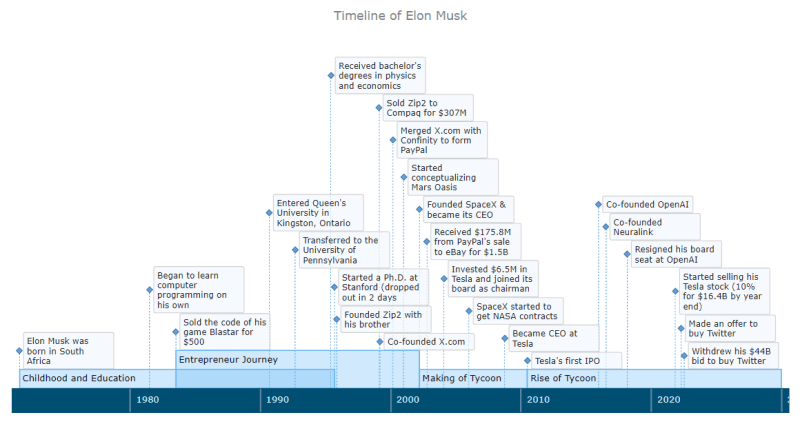
Timeline Chart Preview
Take a look at the beautiful JavaScript timeline chart that I will be creating along the tutorial, and keep reading to find out how!

4 Steps to Build Basic JS Timeline Chart
Creating an interactive JavaScript-based timeline chart, even a basic one, may seem to be a daunting task. But right now, you’ll see how to do it with ease.
In this tutorial, the process of building a JS timeline chart is split into four steps: creating a web page, adding scripts, setting data, and configuring the visualization.
A stunning basic timeline chart will be arranged in just a few lines of easy-to-comprehend code. Then I will show you how it can be customized (also without much complexity). Follow me!
1. Creating a web page
First, I make a simple web page with an HTML block element. That’s where my JavaScript-based timeline chart will appear.
I provide this element with an ID and set its height and weight as 100% so that the visualization takes the entire page.
<html>
  <head>
    <title>JavaScript Timeline Chart</title>
    <style type="text/css">
      html, body, #container {
        width: 100%; height: 100%; margin: 0; padding: 0;
      }
    </style>
  </head>
  <body>
    <div id="container"></div>
  </body>
</html>
2. Adding scripts
Second, I add all scripts I am going to build a timeline chart with to the <head> section of the HTML page.
In this tutorial, I will be using AnyChart JS Charts, a robust JavaScript charting library with vast out-of-the-box capabilities that make it easy to quickly visualize data in dozens of chart types including timelines.
Here, I need the Core and Timeline modules.
<html>
  <head>
    <title>JavaScript Timeline Chart</title>
    <script src="https://cdn.anychart.com/releases/8.11.0/js/anychart-core.min.js"></script>
    <script src="https://cdn.anychart.com/releases/8.11.0/js/anychart-timeline.min.js"></script>
    <style type="text/css">
      html, body, #container {
        width: 100%; height: 100%; margin: 0; padding: 0;
      }
    </style>
  </head>
  <body>
    <div id="container"></div>
    <script>
      // All the JS code for the timeline chart will go here.
    </script>
  </body>
</html>
3. Setting data
Third, I set the data I want to visualize in a JS timeline chart.
There will be two series of different types, range and moment. Each will be added through a separate function.
The range series is for periods. Each data point has a name along with start and end dates.
function rangeData() {
  return [
    {
      name: "Childhood and Education",
      start: "1971/06/28",
      end: "1995/09/01"
    },
    {
      name: "Entrepreneur Journey",
      start: "1983/06/28",
      end: "2002/03/13"
    },
    {
      name: "Making of Tycoon",
      start: "2002/03/14",
      end: "2010/06/28"
    },
    {
      name: "Rise of Tycoon",
      start: "2010/06/29",
      end: "2030/01/01"
    }
  ];
}
The moment series is for individual events. Each data point has a date and text.
function momentData() {
  return [
    ["1971/06/28", "Elon Musk was born in South Africa"],
    ["1981/06/28", "Began to learn computer programming on his own"],
    ["1983/06/28", "Sold the code of his game Blastar for $500"],
    ["1990/09/01", "Entered Queen's University in Kingston, Ontario"],
    ["1992/09/01", "Transferred to the University of Pennsylvania"],
    ["1995/06/01", "Received bachelor's degrees in physics and economics"],
    ["1995/09/01", "Started a Ph.D. at Stanford (dropped out in 2 days"],
    ["1995/11/06", "Founded Zip2 with his brother"],
    ["1999/02/01", "Sold Zip2 to Compaq for $307M"],
    ["1999/03/01", "Co-founded X.com"],
    ["2000/03/01", "Merged X.com with Confinity to form PayPal"],
    ["2001/01/01", "Started conceptualizing Mars Oasis"],
    ["2002/03/14", "Founded SpaceX & became its CEO"],
    ["2002/10/03", "Received $175.8M from PayPal's sale to eBay for $1.5B"],
    ["2004/02/01", "Invested $6.5M in Tesla and joined its board as chairman"],
    ["2006/01/01", "SpaceX started to get NASA contracts"],
    ["2008/10/01", "Became CEO at Tesla"],
    ["2010/06/29", "Tesla's first IPO"],
    ["2015/12/11", "Co-founded OpenAI"],
    ["2016/07/01", "Co-founded Neuralink"],
    ["2018/02/21", "Resigned his board seat at OpenAI"],
    ["2021/11/06", "Started selling his Tesla stock (10% for $16.4B by year end)"],
    ["2022/04/13", "Made an offer to buy Twitter"],
    ["2022/07/08", "Withdrew his $44B bid to buy Twitter"]
  ];
}
Alright! We’ve got a page, scripts, and data ready. Now, it’s time to add some JavaScript charting code to complete the intended interactive timeline chart visualization!
4. Configuring the visualization
To start with, we add the data from the previous step. Then we use a function to ensure that our subsequent code configuring the timeline chart is executed when the web page is already loaded.
<script>

  // set the range series data
  function rangeData() {
    return [
      {
        name: "Childhood and Education",
        start: "1971/06/28",
        end: "1995/09/01"
      },
      {
        name: "Entrepreneur Journey",
        start: "1983/06/28",
        end: "2002/03/13"
      },
      {
        name: "Making of Tycoon",
        start: "2002/03/14",
        end: "2010/06/28"
      },
      {
        name: "Rise of Tycoon",
        start: "2010/06/29",
        end: "2030/01/01"
      }
    ];
  }

  // set the moment series data
  function momentData() {
    return [
      ["1971/06/28", "Elon Musk was born in South Africa"],
      ["1981/06/28", "Began to learn computer programming on his own"],
      ["1983/06/28", "Sold the code of his game Blastar for $500"],
      ["1990/09/01", "Entered Queen's University in Kingston, Ontario"],
      ["1992/09/01", "Transferred to the University of Pennsylvania"],
      ["1995/06/01", "Received bachelor's degrees in physics and economics"],
      ["1995/09/01", "Started a Ph.D. at Stanford (dropped out in 2 days"],
      ["1995/11/06", "Founded Zip2 with his brother"],
      ["1999/02/01", "Sold Zip2 to Compaq for $307M"],
      ["1999/03/01", "Co-founded X.com"],
      ["2000/03/01", "Merged X.com with Confinity to form PayPal"],
      ["2001/01/01", "Started conceptualizing Mars Oasis"],
      ["2002/03/14", "Founded SpaceX & became its CEO"],
      ["2002/10/03", "Received $175.8M from PayPal's sale to eBay for $1.5B"],
      ["2004/02/01", "Invested $6.5M in Tesla and joined its board as chairman"],
      ["2006/01/01", "SpaceX started to get NASA contracts"],
      ["2008/10/01", "Became CEO at Tesla"],
      ["2010/06/29", "Tesla's first IPO"],
      ["2015/12/11", "Co-founded OpenAI"],
      ["2016/07/01", "Co-founded Neuralink"],
      ["2018/02/21", "Resigned his board seat at OpenAI"],
      ["2021/11/06", "Started selling his Tesla stock (10% for $16.4B by year end)"],
      ["2022/04/13", "Made an offer to buy Twitter"],
      ["2022/07/08", "Withdrew his $44B bid to buy Twitter"]
    ];
  }

  anychart.onDocumentReady(function() {
    // The (following) timeline charting code lands here.
  });

</script>
Then, within the anychart.onDocumentReady() function, I create a timeline chart instance using the timeline() function, set both series, and make the range series labels display the name attribute.
// create a timeline chart
let chart = anychart.timeline();

// create a range series
let rangeSeries = chart.range(rangeData());

// create a moment series
let momentSeries = chart.moment(momentData());

// configure the range series label settings
rangeSeries.labels().format("{%name}");
Also right there, I add a few more lines to entitle the timeline chart, define a container for it, and finally, command to draw the resulting graphic.
// set the chart title
chart.title("Timeline of Elon Musk");

// set the chart container id
chart.container("container");

// draw the chart
chart.draw();
Result: Basic JS Timeline Chart
There you go! A cool interactive JavaScript timeline chart visualization is ready. And it has been far from difficult to build one, hasn’t it?
Here’s the complete code for this timeline chart. It is also available on AnyChart Playground.
<html>
  <head>
    <title>JavaScript Timeline Chart</title>
    <script src="https://cdn.anychart.com/releases/8.11.0/js/anychart-core.min.js"></script>
    <script src="https://cdn.anychart.com/releases/8.11.0/js/anychart-timeline.min.js"></script>
    <style type="text/css">
      html, body, #container {
        width: 100%; height: 100%; margin: 0; padding: 0;
      }
    </style>
  </head>
  <body>
    <div id="container"></div>
    <script>

      // set the range series data
      function rangeData() {
        return [
          {
            name: "Childhood and Education",
            start: "1971/06/28",
            end: "1995/09/01"
          },
          {
            name: "Entrepreneur Journey",
            start: "1983/06/28",
            end: "2002/03/13"
          },
          {
            name: "Making of Tycoon",
            start: "2002/03/14",
            end: "2010/06/28"
          },
          {
            name: "Rise of Tycoon",
            start: "2010/06/29",
            end: "2030/01/01"
          }
        ];
      }

      // set the moment series data
      function momentData() {
        return [
          ["1971/06/28", "Elon Musk was born in South Africa"],
          ["1981/06/28", "Began to learn computer programming on his own"],
          ["1983/06/28", "Sold the code of his game Blastar for $500"],
          ["1990/09/01", "Entered Queen's University in Kingston, Ontario"],
          ["1992/09/01", "Transferred to the University of Pennsylvania"],
          ["1995/06/01", "Received bachelor's degrees in physics and economics"],
          ["1995/09/01", "Started a Ph.D. at Stanford (dropped out in 2 days"],
          ["1995/11/06", "Founded Zip2 with his brother"],
          ["1999/02/01", "Sold Zip2 to Compaq for $307M"],
          ["1999/03/01", "Co-founded X.com"],
          ["2000/03/01", "Merged X.com with Confinity to form PayPal"],
          ["2001/01/01", "Started conceptualizing Mars Oasis"],
          ["2002/03/14", "Founded SpaceX & became its CEO"],
          ["2002/10/03", "Received $175.8M from PayPal's sale to eBay for $1.5B"],
          ["2004/02/01", "Invested $6.5M in Tesla and joined its board as chairman"],
          ["2006/01/01", "SpaceX started to get NASA contracts"],
          ["2008/10/01", "Became CEO at Tesla"],
          ["2010/06/29", "Tesla's first IPO"],
          ["2015/12/11", "Co-founded OpenAI"],
          ["2016/07/01", "Co-founded Neuralink"],
          ["2018/02/21", "Resigned his board seat at OpenAI"],
          ["2021/11/06", "Started selling his Tesla stock (10% for $16.4B by year end)"],
          ["2022/04/13", "Made an offer to buy Twitter"],
          ["2022/07/08", "Withdrew his $44B bid to buy Twitter"]
        ];
      }

      anychart.onDocumentReady(function () {

        // create a timeline chart
        let chart = anychart.timeline();

        // create a range series
        let rangeSeries = chart.range(rangeData());

        // create a moment series
        let momentSeries = chart.moment(momentData());

        // configure the range series label settings
        rangeSeries.labels().format("{%name}");

        // set the chart title
        chart.title("Timeline of Elon Musk");

        // set the chart container id
        chart.container("container");

        // draw the chart
        chart.draw();

      });

    </script>
  </body>
</html>
Creating Custom JS Timeline Chart
The timeline looks engrossing as is. But there is always room for improvement! I will show you how some parts of such a JavaScript timeline chart can be nicely customized, again without much hassle.
- Colors
- Series labels and height
- Title
- Tooltip
- Scroller
- Context menu and export
FOR A WALKTHROUGH OF THESE JS TIMELINE CHART CUSTOMIZATIONS, CONTINUE READING HERE.

Top comments (0)