
In this post I show how the endpoint routes in an ASP.NET Core 3.0 application can be visualized using the GraphvizOnline service. That lets you create diagrams like the following, which describe all the endpoints in your application:

Drawing graphs with GraphvizOnline and the DOT language
GraphvizOnline is a GitHub project that provides an online vizualizer for viewing graphs specified in the DOT graph description language. This is a simple language that lets you define various types of graph, which connects nodes with edges.
For example, a basic undirected graph could be defined as
graph MyGraph {
  a -- b -- c;
  b -- d;
}
which describes the following graph:

Each node has a name (a, b, c, d), and -- defines the edges between the nodes. The edges define connections between nodes, but they don't have a direction (hence the name, undirected).
You can also define a directed graph, in which the edges do have a direction. For a directed edge use -> instead of --. For example:
digraph MyGraph {
  a -> b -> c;
  d -> b;
}
which describes the following graph:

You can customise the way the nodes and edges are displayed in multiple ways. For example, you can label the nodes and edges:
digraph MySimpleGraph {
   // The label attribute can be used to change the label of a node...
   a [label="Foo"];
   b [label="Bar"];
   // ... or an edge
   a -> b [label="Baz"];
}

There's way more you can do with the DOT graph description language, but that's all we need for now. So how does this apply to ASP.NET Core?
Visualizing ASP.NET Core endpoints as a directed graph
The endpoint routing system in ASP.NET Core effectively works by creating a directed graph of the endpoint URL segments. Incoming requests are then matched, a segment at a time, to the graph to determine the endpoint to execute.
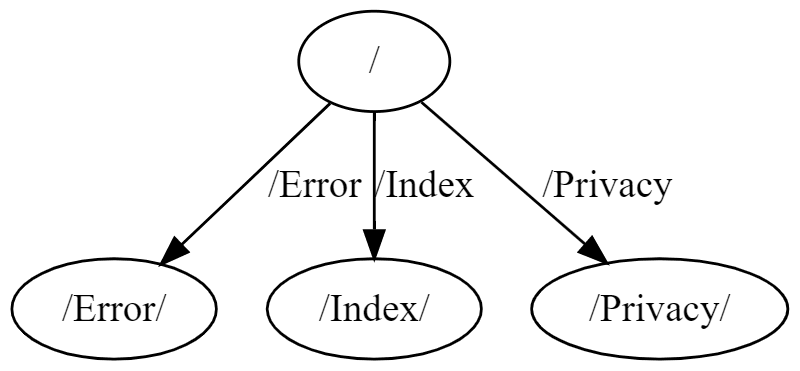
For example, the following simple directed graph represents the endpoints in the default ASP.NET Core 3.0 Razor Pages application template (dotnet new webapp), which contains three Razor Pages: Index.cshtml, Error.cshtml and Privacy.cshtml:
digraph DFA {
  1 [label="/Error/"]
  2 [label="/Index/"]
  3 [label="/Privacy/"]
  4 -> 1 [label="/Error"]
  4 -> 2 [label="/Index"]
  4 -> 3 [label="/Privacy"]
  4 [label="/"]
}
which describes:
 .
.
In the DOT file above, the nodes are given sequential integer names,
1,2,3etc and are labelled using the endpoint name. This is the format ASP.NET Core uses for representing the endpoint graph.
For Razor Pages, the routing is very simple, so the graph is pretty obvious. A more interesting graph is produced by an API application. For example, the ValuesController implementation shown below is similar to the version included in the ASP.NET Core 2.0 templates. It uses multiple HTTP verbs, as well as a slightly more complex URL structure:
[Route("api/[controller]")]
[ApiController]
public class ValuesController : ControllerBase
{
    // GET api/values
    [HttpGet]
    public ActionResult<IEnumerable<string>> Get() => new string[] { "value1", "value2" };

    // GET api/values/5
    [HttpGet("{id}")]
    public ActionResult<string> Get(int id) => "value";

    // POST api/values
    [HttpPost]
    public void Post([FromBody] string value) { }

    // PUT api/values/5
    [HttpPut("{id}")]
    public void Put(int id, [FromBody] string value) { }

    // DELETE api/values/5
    [HttpDelete("{id}")]
    public void Delete(int id) { }
}
For good measure, I also added a basic health check endpoint to UseEndpoints():
app.UseEndpoints(endpoints =>
{
    endpoints.MapHealthChecks("/healthz");
    endpoints.MapControllers();
});
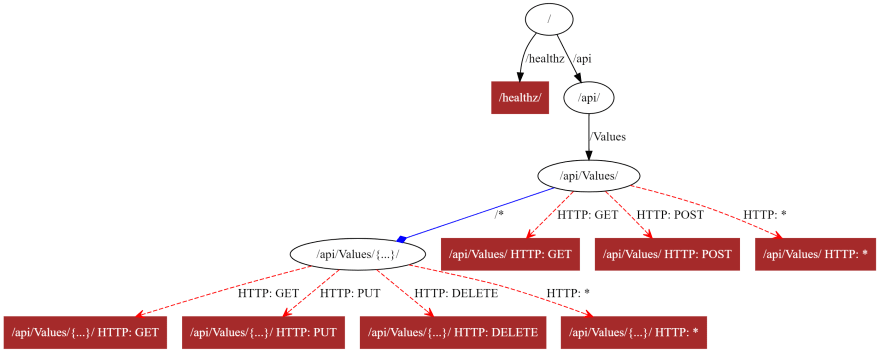
This app produces the following graph:
digraph DFA {
  1 [label="/healthz/"]
  2 [label="/api/Values/{...}/ HTTP: GET"]
  3 [label="/api/Values/{...}/ HTTP: PUT"]
  4 [label="/api/Values/{...}/ HTTP: DELETE"]
  5 [label="/api/Values/{...}/ HTTP: *"]
  6 -> 2 [label="HTTP: GET"]
  6 -> 3 [label="HTTP: PUT"]
  6 -> 4 [label="HTTP: DELETE"]
  6 -> 5 [label="HTTP: *"]
  6 [label="/api/Values/{...}/"]
  7 [label="/api/Values/ HTTP: GET"]
  8 [label="/api/Values/ HTTP: POST"]
  9 [label="/api/Values/ HTTP: *"]
  10 -> 6 [label="/*"]
  10 -> 7 [label="HTTP: GET"]
  10 -> 8 [label="HTTP: POST"]
  10 -> 9 [label="HTTP: *"]
  10 [label="/api/Values/"]
  11 -> 10 [label="/Values"]
  11 [label="/api/"]
  12 -> 1 [label="/healthz"]
  12 -> 11 [label="/api"]
  12 [label="/"]
}
Which is visualised as:
There's a lot more going on in this graph, as we now have variable route parameter values ({id} in the route templates, shown as {...} in the graph) and HTTP verb constraints (GET/PUT/POST etc).
When I first saw this graph, I struggled to understand it. Is every node an endpoint? Surely not, as /api/ shouldn't generate a response. And what about the HTTP: * endpoints, do they generate a response?
To understand further, I went spelunking into the ASP.NET Core code that can generate these graphs, but it's a bit involved, and unfortunately not overly amenable to experimentation, due to extensive use of
internalclasses. I explore this code in a later post.
To better grasp the endpoint graph, we need to understand that not all the nodes are the same. In the next section we'll dig into the different types of node in even this simple graph, and then look at a better graphical representation (in my opinion at least!)
Understanding the different types of node.
Each node in the graph is associated with a given "depth". This is the number of URL segments that should already be matched. For example, the /api/Values/ node has a depth of 2—it requires the empty segment / and the /api segment to already be matched.
When a request reaches the EndpointRoutingMiddleware (added by UseRouting()), the incoming request URL is compared against this graph. A path is attempted to be found through the graph, starting with the root node at the top of the tree. URL segments are incrementally matched to edges in the graph, and a path is traversed through the graph until the whole request URL is matched.
Each node (represented by the DfaNode in ASP.NET Core internally) has several properties . The properties we're interested in for now are:
-
Matches: This is theEndpoint(s) associated with the node. If this node is matched via routing, then this is theEndpointthat will be selected for execution. -
Literals: These are the edges that connect nodes. If aDfaNodehas anyLiterals, it has literal segments that can be further traversed to reached other nodes. For example, the/api/node contains a singleLiteralwith value/Values, pointing to the/api/Valuesnode. -
PolicyEdges: These are edges that match based on a constraint other than the URL. For example, the verb-based edges in the graph, such asHTTP: GET, are policy edges, that point to a differentDfaNode. -
Parameters: If the node has an edge that supports route parameters (e.g.{id}),Parameterspoints to the node that handles matching the parameters. This is represented in the graph by the edge/*.
There is an additional property,
CatchAll, which is relevant in some graphs, but I'll ignore it for now, as it's not required for our API graph.
Based on these properties, we can add some additional richness to our graph, by making use of some of the other features in the DOT language, such as shapes, colours, line type and arrowheads:
This graph makes the following additions:
- Nodes which don't have any associated
Endpointare shown in the default style, black bubbles. - Nodes with
Matchesare shown as filled, brown, boxes. These are nodes with anEndpoint, that can generate a response. For the API example above, this applies to the nodes where a verb has been selected, as well as the health check endpoint. - Literal segment edges are shown as default black edges, with a filled arrowhead.
-
Parametersedges (/*) are shown in blue, using a diamond arrowhead. -
PolicyEdgesare shown in red, with a dashed line, and an empty triangle arrowhead.
Now, I freely admit my design skills suck, but nevertheless I think you can agree that this graph shows way more information than the default! 🙂 This is the definition that generated the graph above, remember you can visualise and play with the display yourself using an online editor.
digraph DFA {
  1 [label="/healthz/" shape=box style=filled color="brown" fontcolor="white"]
  2 [label="/api/Values/{...}/ HTTP: GET" shape=box style=filled color="brown" fontcolor="white"]
  3 [label="/api/Values/{...}/ HTTP: PUT" shape=box style=filled color="brown" fontcolor="white"]
  4 [label="/api/Values/{...}/ HTTP: DELETE" shape=box style=filled color="brown" fontcolor="white"]
  5 [label="/api/Values/{...}/ HTTP: *" shape=box style=filled color="brown" fontcolor="white"]
  6 -> 2 [label="HTTP: GET" color="red" style=dashed arrowhead=open]
  6 -> 3 [label="HTTP: PUT" color="red" style=dashed arrowhead=open]
  6 -> 4 [label="HTTP: DELETE" color="red" style=dashed arrowhead=open]
  6 -> 5 [label="HTTP: *" color="red" style=dashed arrowhead=open]
  6 [label="/api/Values/{...}/"]
  7 [label="/api/Values/ HTTP: GET" shape=box style=filled color="brown" fontcolor="white"]
  8 [label="/api/Values/ HTTP: POST" shape=box style=filled color="brown" fontcolor="white"]
  9 [label="/api/Values/ HTTP: *" shape=box style=filled color="brown" fontcolor="white"]
  10 -> 6 [label="/*" arrowhead=diamond color="blue"]
  10 -> 7 [label="HTTP: GET" color="red" style=dashed arrowhead=open]
  10 -> 8 [label="HTTP: POST" color="red" style=dashed arrowhead=open]
  10 -> 9 [label="HTTP: *" color="red" style=dashed arrowhead=open]
  10 [label="/api/Values/"]
  11 -> 10 [label="/Values"]
  11 [label="/api/"]
  12 -> 1 [label="/healthz"]
  12 -> 11 [label="/api"]
  12 [label="/"]
}
Note the
"HTTP: *"nodes are associated with an endpoint, even though you might not expect it, because they return a405 Method Not Allowed.
In the next post, I'll show how you can generate endpoint graphs for your own ASP.NET Core applications.
Summary
In this post I provided an introduction to the DOT language for describing graphs, and showed how you can use online editors to create images from the graphs. I then showed how routing for endpoints in an ASP.NET Core 3.x application can be represented as a directed graph. I described the differences between various nodes and edges in the endpoint graph, and tweaked the graph's display to better represent these differences. In later posts I'll show how you can generate your own endpoint graphs for your application, how to customise the display, and how to do more than just view the graphs.


Top comments (0)