Why I chose this project?
Being a sports fan and a mathematician at heart, I was inspired a lot by the movie Moneyball. How Paul DePodesta (portrayed by Jonah Hill) and Billy Beane (portrayed by Brad Pitt) fought popular opinion, leveraged baseball statistics and mathematical principles to change the game for a small market team in the Oakland Athletics was a revelation and a delight to watch. This invoked my curiosity and led me to look under the hood as to see what they had done to achieve such unprecedented success.
Components of the Project
There are 2 parts to this project
1) Debunking Moneyball the movie
2) Leveraging Moneyball principles to predict All Star players!
Link to Code
You can find the code to this project here :)
Phase 1 - Debunking Moneyball
The code for this phase can be found in this notebook
The initial thought was to understand what data they had at hand and what they were aiming for, which as gathered from the movie, was to make the playoffs. Considering it was the 2002 season, I truncated my dataset (can be obtained from Kaggle here).
After visualising Teams vs Number of Wins and calculating the average number of wins required to make the playoffs until 2001, as shown below.
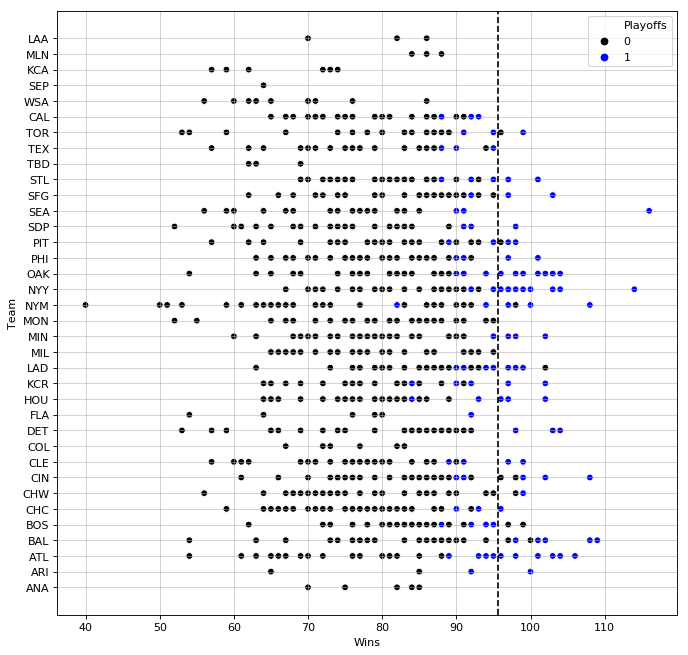
I gleaned that the Athletics or the As needed 95+ wins to make the playoffs in 2002. In order to win games in baseball, you need to score more runs than your opponent (captain obvious). So to do that, the As needed to figure out how to score more than their opponents, which was based on the stat, Run Differential(RD).
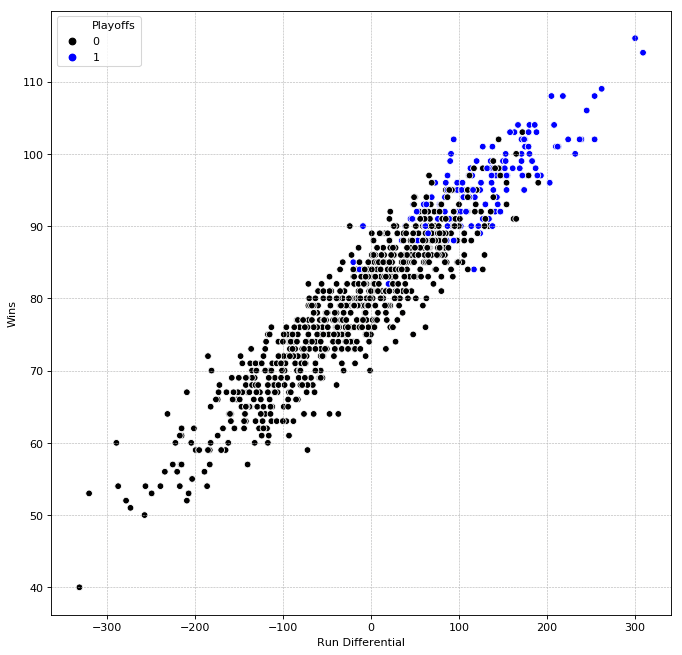
Run Differential(RD) = Runs Scored(RS) - Runs Allowed(RA).
The correlation between the two can be observed from the following graph.
I built 3 linear regression models to decode how to do it. Please follow the notebook linked above for a more detailed explanation. The models are chained as follows:
- Wins vs Run Differential (After knowing W = 96, using this model, I obtained the reqd RD = 134)
- Runs Scored vs OBP and SLG (On-Base Percentage and Slugging Rate)*
- Runs Allowed vs OOBP and OSLG (Opponent OBP and Opponent SLG)
Final Calculations
From the equations obtained and the As pitching stats (OOBP, OOSLG) in 2001, we can figure that the A's would concede 635 runs.
Therefore, they needed, 635 + 134 ~= 770 runs to make the playoffs in 2002 **.
Plugging in the A's stats (OBP, SLG, OOBP, OSLG) from 2002,
We get our Calculated Run Differential(CRD) to be 146. (Please refer notebook for more details).
And the Actual Run Differential that year was in fact, 146.
Plugging that CRD value into our Wins vs RD regression model, we obtain that the A's would've won 97 games.
This confirms our assumptions that they needed 95+ wins to make the playoffs, which they did and won 103 games while doing so.
This kind of smart, statistical analyisis by DePodesta and excellent roster management by Billy Beane led the Oakland As to 103 wins, and they made the playoffs, ranking first in the regular season with a 41mil payroll while the Yankees' payroll topped 125mil the same year. Incredible.
Phase 2 - Predicting All Star players for 2012!
The code for this phase can be found in this notebook.
By using the same principles as used in Moneyball, I first built a regression model for Wins vs RD for MLB seasons until the 2012 season.
Then I followed the same regression model chain as mentioned above, with a few modifications:
1) To avoid multi-variate regression, I used the popular linear combination of OBP and SLG called OPS (On Base Percent + Slugging)
2) Runs Scored vs OPS was built.
3) Runs Allowed vs OOPS was built.
With these models and the same calculation logic as before, I predicted 11 batters to have made the All Star Team that year, and lo and behold, 10 of them did!
In fact, 6 of the predicted batters were starters as well in the 2012 All Star Game.
Similarly, I had very good results for pitcher prediction, I predicted 5 pitchers to have made the All-Star Team in 2012, and all 5 of them did!
This proves that the Moneyball theory is still very applicable and I'm sure with more feature engineering and complex models built on the basic principles, statistics in baseball (sabermetrics) can continue to change the game.
Notes
* We obtain these attributes being more relevant from the correlation matrix, which contradicted the age old notion that Batting Average is the mark of excellence for a batter
** Since the scouts were valuing players only in terms of Batting Average(BA), they were able to create a highly effective roster under their marginalised salary budget.

Top comments (0)