Introduction:
We are going to analyze the credit data and for what purpose people use it for, using German credit card data, published by UCL. The data set contains the following fields:
- Age (numeric)
- Sex (text: male, female)
- Job (numeric: 0 - unskilled and non-resident, 1 - unskilled and resident, 2 – skilled, 3 - highly skilled)
- Housing (text: own, rent, or free)
- Saving accounts (text - little, moderate, quite rich, rich)
- Checking account (numeric, in DM - Deutsch Mark)
- Credit amount (numeric, in DM)
- Duration (numeric, in month)
- Purpose (text: car, furniture/equipment, radio/TV, domestic appliances, repairs, 10. education, business, vacation/others)
This problem could be subjected to multi-class analysis, but we are going to try it as a clustering problem. Why as a clustering problem you say? Because, lets say we have to normalize the data in-term of what would be the better approach to divide underlying customers in groups. Marketing segmentation relies heavily on segmenting their customers to get a better understanding of a group. As in this database, there are many columns that describes a behavior of a user in-terms of what is his gender, how much credits a person has used, how much money he has in his savings account etc. We are more interested in how to draw a boundary to grip the problem and deduce results based on groups. Why groups? So, that we can understand better in terms of what is the general trend of buying in these groups. Lets, say you introduce a new user to the record, with a help of a little bit of history with the system, you would be able to pitch a better loan scheme to a customer in a group.
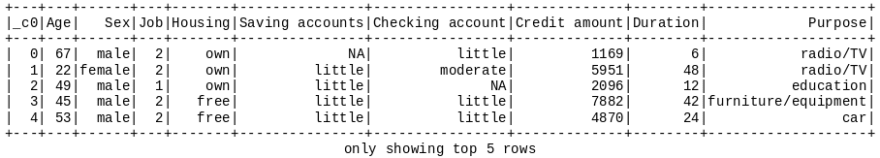
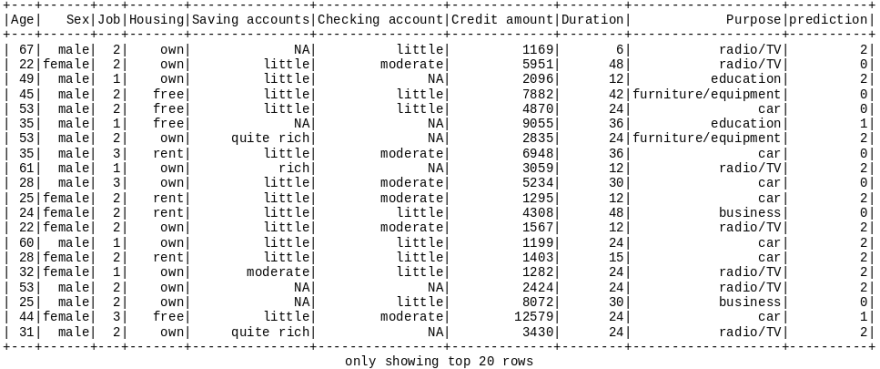
The Data set looks like this upon show() command:
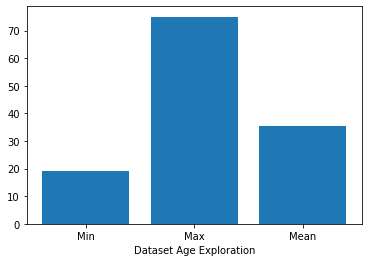
Lets check the minimum, maximum, average “Age” of the user/s in the data set.
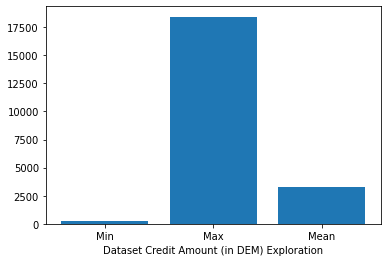
Lets check the minimum, maximum, average Credit Amount Spent” of the user/s in the data set.
Lets start the most trivial categorization used in market segmentation, i-e segmentation done using gender, to see if that works.
To start with, lets check the average amount of credits spent by gender:
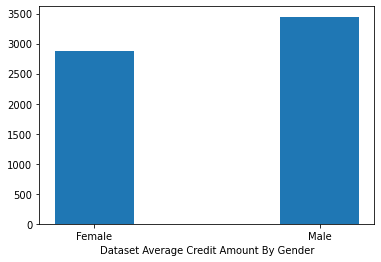
We can see a little bit of difference in average credit spent. Lets check the trends in buying and total credit spent on each category, for both genders:
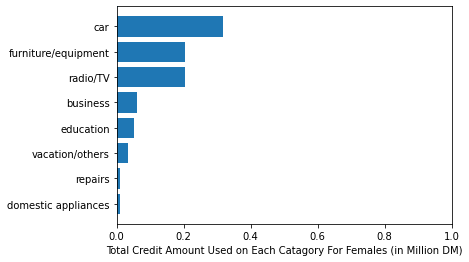
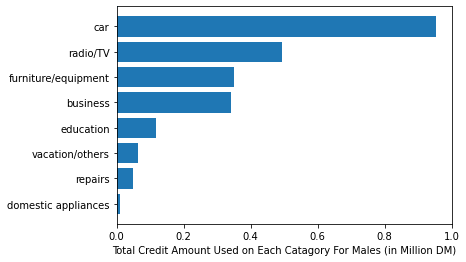
We got two type of differentiation. First, one is the total credits spent on each category and the second one is the top 2nd and 3rd category is different for both. First offset is maybe due to difference in average credit spent, as scene above, but the second differentiation is based on what is the buying trend using credit amount. For Females the 2nd most favorite is “furniture/equipment” category and for males it is “radio/TV”.
We got a differentiation, but its not much to base all of the recommendations for loans etc.
Lets start Clustering:
We used Apache Spark as the framework and Kmeans for clustering the data. Since, we have so many categorical variables, like Housing/ Saving accounts etc, we had to first index these string columns to numeric classes using Spark’s “StringIndexer” and then transform into feature vectors. These feature vectors were then fed to the Kmeans algorithm. The Kmeans algorithm was trained for k = 2 up-to k = 6. The error scores for each iteration are given below

We selected k = 3 as it drops the error rate significantly and next iterations doesn’t really provides much reduction in the error. The results for k = 3 are:
Lets visualize and find trends in Group 0,1 and 2.

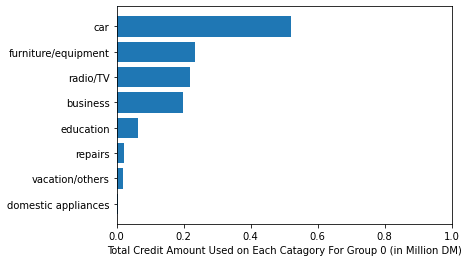
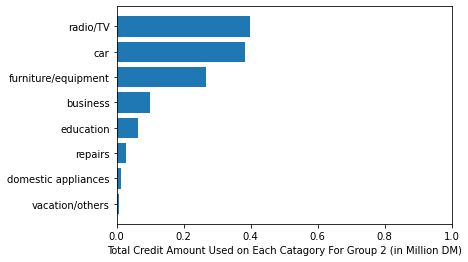
We got three advantages by introducing clustering. The groups have successfully eliminated the average credit amount spend differentiation. Now, each group has different representation of trends in credit amount spend. But, here’s the catch. I looked up the total users spending on a category in each group, what I found out was there was a group, far significant in number but dominating all three categories in terms of credit spent on “cars”. So, lets explore it by average credits spent on each category for each group.
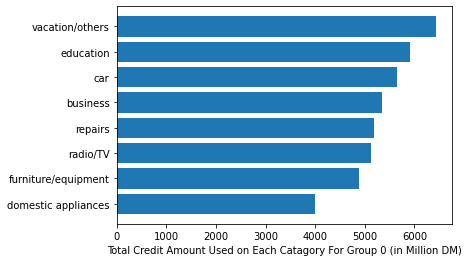
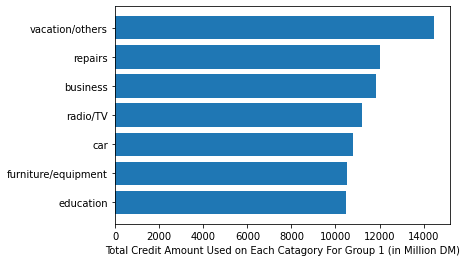
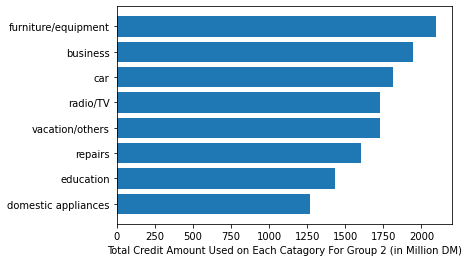
Voila, not only each group spent differently on each category on average, we can distinguish by this demarcation, about whats the most aggressively bought item for each category………….


Top comments (3)
You've developed quite an interesting approach to determining the average amount of spending on purchases. Of course, such a tendency to spend money on certain goods you can notice without such complex algorithms. You can download the spending tracking app. After a month, you can write out all groups of purchases in a Word Document. After that, you'll look at the money spent on purchase groups. So you'll conclude from what you have seen without graphs and tables, you know. When During our consultations with Mortgage Broker Nottingham, we raised various topics. One of the topics was a way to pay mortgage bills more regularly. This method is that we first deduct the monthly mortgage payment amount from our salary, and after that, we start our expenses.
is this an appreaciation or a sarcastic comment? (")
Looks nice, but could use some code.
Some comments may only be visible to logged-in visitors. Sign in to view all comments.