Data Science Process
Why is it called Data Science?
So, what exactly does it mean to do data science?
Professionals who do data science are driven by a desire to ask questions. Questions like, how many customers prefer website A to website B? Are wildfires in California getting bigger? Is Fenty Makeup more inclusive than other foundations?
To answer these questions, data scientists use a process of experimentation and exploration to find answers. Sound familiar? Like other scientific fields, data science follows the scientific method. But the data science process also includes steps particular to working with large, digital datasets.
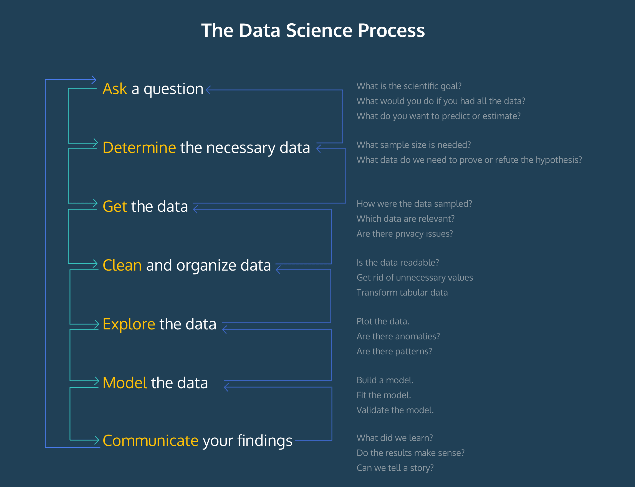
The process generally goes as follows:
Ask a question
Determine the necessary data
Get the data
Clean and organize the data
Explore the data
Model the data
Communicate your findings
In this lesson, we’re going to dig into the data science process. While we present these steps as a linear process, it’s important to keep in mind that you’ll often repeat steps or do things out of order. Consider this to be a set of guidelines to get you started.
Step 1-Determine the Necessary Data
After you have a question, you have to make an educated guess about what you think the answer might be. This educated guess is known as a hypothesis and helps to determine the data you need to collect.
It’s important to remember that the data you decide to collect can’t just be the data that you think is going to answer your question. We can’t carefully select for what we know will prove the hypothesis is correct — actually, the data needs to disprove the hypothesis.
What do we mean by that?
In science, it’s actually impossible to prove that something is true. Rather, we try and show that we’re really, really confident that it’s not false. That’s because the only way we can say we’re 100% positive our hypothesis is correct is to collect all the data for an entire population — and that’s pretty much impossible!
So, how do we determine what data is necessary to collect?
First, we need to determine what data could disprove our hypothesis. For example, if our hypothesis is that Sriracha is the most popular hot sauce in the entire world, we can’t just survey a group of 100 people and ask if they prefer Sriracha over Frank’s Red Hot. We would need to look at how Sriracha consumption compares to the consumption of multiple other brands of hot sauce.
Next, we need to figure out how much data to collect. While it’s preferable to get information for an entire population, that process is often difficult or impractical. So instead, we collect a sample set of data, a smaller amount of data that are representative of the entire population.
How do we ensure that our sample is representative? We figure out the necessary number of samples that have similar descriptive statistics to the entire population. For example, say that we want to know the length of oysters in Long Island. Our hypothesis is that they’re about three inches. If we collect five oyster shells, they may only measure, on average, two inches. However, if we collect 145 more, we’ll find that the average is closer to three inches.
Rule of thumb: the larger the sample size and the more diverse your dataset is, the more confident you’ll be in your results. We don’t want to go through the trouble of designing and running an experiment only to discover that we don’t have enough information to make a good decision!
Step 2-Getting Data
Once you’ve determined which data you need, it’s time to collect it!
Data collection can be as simple as locating a file or as complicated as designing and running an experiment.
Here are a couple of different ways to get data:
Active data collection — you’re setting up specific conditions in which to get data. You’re on the hunt. Examples include running experiments and surveys.
Passive data collection — you’re looking for data that already exists. You’re foraging for data. Examples include locating datasets and web scraping.
There are a couple of things to keep in mind when we collect data. An important one is the size of our dataset. Remember that we usually can’t get data from an entire population, so we need to have an appropriate sample that is representative of the larger population. If you’re ever unsure about the size of your dataset, use a sample size calculator.
Another thing to keep in mind is that errors and bias can occur in data collection. For example, early facial recognition software was trained on datasets that disproportionately contained portraits of white males. Other developers continued to use these datasets and for many years, facial recognition software was not adequate at recognizing other faces. Again, having a larger sample size is one way to mitigate errors and bias.
Step 3-Cleaning Data
As soon as you get your data, you’ll be excited to get started. But wait just one moment — we might be ready to go, but how can we be sure that our data is?
Data is typically organized in columns and rows as you’d see in a spreadsheet. But raw data can actually come in a variety of file types and formats. This is especially true if you’re getting your data from elsewhere, like public datasets.
We as humans may be able to understand the organizing logic of a dataset, but computers are very literal. A missing value or unlabeled column can completely throw them off their game. Even worse — your program could still run, but your outcomes would be incorrect. Ouch!
An important part of the data science process is to clean and organize our datasets, sometimes referred to as data wrangling. Processing a dataset could mean a few different things. For example, it may mean getting rid of invalid data or correctly labeling columns.
The Python library Pandas is a great tool for importing and organizing datasets. You can use Pandas to convert a spreadsheet document, like a CSV, into easily readable tables and charts known as DataFrames. We can also use libraries like Pandas to transform our datasets by adding columns and rows to an existing table, or by merging multiple tables together!
Step 4-Explore the Data
Now that our data is organized, we can begin looking for insights. But just because our data is all cleaned up, we still can’t learn a lot by staring at tables. In order to truly explore our data, we’ll need to go a few steps further.
Exploring a dataset is a key step because it will help us quickly understand the data we’re working with and allow us to determine if we need to make any changes before moving forward. Changes could include some additional dataset cleaning, collecting more data, or even modifying the initial question we’re trying to answer. Remember: data science is not necessarily a linear process.
There are two strategies for exploring our data:
Statistical calculations
Data visualizations
STATISTICAL CALCULATIONS
When we first get a dataset, we can use descriptive statistics to get a sense of what it contains. Descriptive statistics summarize a given dataset using statistical calculations, such as the average (also known as mean), median, and standard deviation. We can immediately learn what are common values in our dataset and how to spread out the dataset is (are most of the values the same, or are they wildly different?).
We can use a Python module known as NumPy to calculate descriptive statistics values. NumPy (short for Numerical Python) supplies short commands to easily perform statistical calculations, like np.mean(), which calculates the mean of a dataset.
DATA VISUALIZATIONS
Another way we can quickly get a sense of our data is by visualizing it. The practice of data visualization enables us to see patterns, relationships, and outliers, and how they relate to the entire dataset. Visualizations are particularly useful when working with large amounts of data.
Python data visualization libraries like Matplotlib and Seaborn can display distributions and statistical summaries for easy comparison. The JavaScript library D3 enables the creation of interactive data visualizations, which are useful for modeling different scenarios.
Step 5 -Modeling and Analysis
Data in hand, we can begin to dig in and analyze what we have. To analyze our data, we’ll want to create a model. Models are abstractions of reality, informed by real data, that allow us to understand situations and make guesses about how things might change given different variables.
A model gives us the relationship between two or more variables. For example, you could build a model that relates the number of grade school children in a neighborhood with sales of toys, or a model that connects the number of trucks that travel certain roads with the amount of a city’s budget assigned to road maintenance.
Models allow us to analyze our data because once we begin to understand the relationships between different variables, we can make inferences about certain circumstances. Why is it that the sales of toys increases as the number of grade school children grows? Well, maybe it’s because parents are buying their children more toys.
Models are also useful for informing decisions, since they can be used to predict unknowns. Once we understand a relationship between variables, we can introduce unknown variables and calculate different possibilities. If the number of children in the neighborhood increases, what do we predict will happen to the sales of toys?
As we collect more data, our model can change, allowing us to draw new insights and get a better idea of what might happen in different circumstances. Our models can tell us whether or not an observed variance is within reason, is due to an error, or possibly carries significance. How would our understanding of our model change if in 2016 we discovered that the number of toys did not increase, but instead, decreased? We’d want to look for an explanation as to why this year did not fit the trend.
Models can be expressed as mathematical equations, such as the equation for a line. You can use data visualization libraries like Matplotlib and Seaborn to visualize relationships. If you pursue machine learning, you can use the Python package scikit-learn to build predictive models, such as linear regressions.
Step 6-Communicating Findings
After you’ve done your analyses, built your models, and gotten some results, it’s time to communicate your findings.
Two important parts of communicating data are visualizing and storytelling.
VISUALIZING
As we saw earlier, visualizations are helpful for exploring and understanding our data; however, they are also very useful for communicating results. So, can you just reuse the ones you already have? Not necessarily. The answer depends on your audience. If you’re giving a presentation at a conference for data scientists who also work at dating companies, then sure, they’ll probably be able to interpret your graphs. But if you’re writing an article for Medium, you’ll probably want to simplify your visualizations and style them so they’re easy to read and highly engaging.
STORYTELLING
It’s also important to remember that visualizations can’t always stand on their own — they need to tell a story. Storytelling is an important part of data science because it gives meaning to the data. In fact, data storytelling is an important practice in its own right. Contextualizing your findings and giving them a narrative draws people into your work and enables you to convince them as to why these results are important and why they should make a certain decision.
To do practice of the above steps follow the link below:
GitHub: medium-code/data science process at main · qasim1020/medium-code (github.com)
Reference: https://www.codecademy.com/

Top comments (0)