Like a well-prepared community bracing for the impact of a natural disaster, databases must be equipped to face unforeseen challenges. In the world of databases, few things are as dreaded as running out of memory, a situation referred to as OOM. Enter Aerospike's savior: the stop-writes condition, a protective measure designed to avert the nightmarish scenario of OOM. It acts as a vigilant sentinel, ensuring your database stays far from the brink of unrecoverable states. Think of it as your emergency go-bag or the life vest under your seat, offering respite when you need it most, though you hope never to use it.
But let's face it, encountering the stop-writes condition can still be quite unsettling and determining the root cause challenging. This is why we're introducing the show stop-writes command. With this powerful tool at your fingertips, you'll swiftly navigate through stop-writes scenarios and get your database back on track. Let's delve into the world of this invaluable command and discover how it ensures the safety and stability of your precious data.
Stop-write configuration
Before we delve into asadm's newest command, let's explore all the different ways you can configure and, more importantly, trigger stop-writes. The configuration you choose depends on what you want to protect.
To restrict a set from going over a certain size or number of records:
To restrict a namespace:
There is one other way the server protects itself, but this feature is not configurable:
As you can see, there are several ways to configure stop-writes, and as a result many ways stop-writes can occur.
Uh Oh! I'm in stop-writes!
Picture this: you find yourself in the unfortunate stop-writes state, perhaps noticing a surge in client write errors.
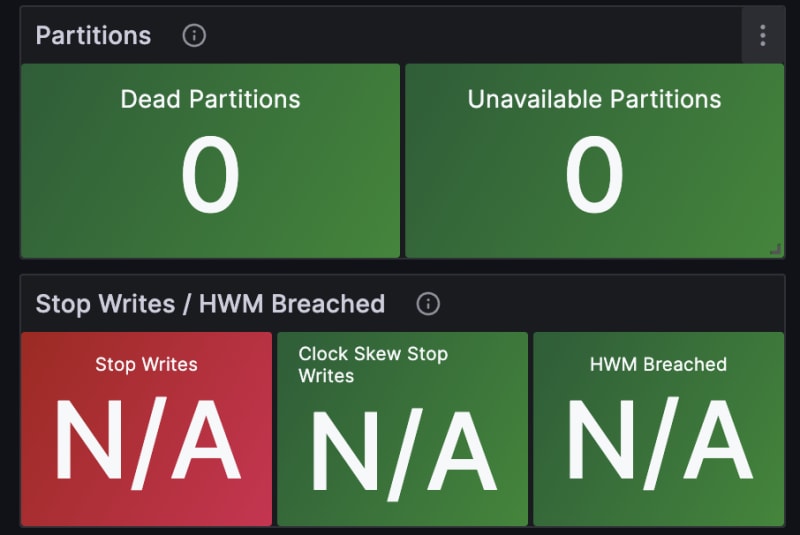
Or you see an alert in Grafana.
Or you see a cryptic logline that reads something like
Jul 25 2023 23:02:02 GMT: WARNING (nsup): (nsup.c:936) {test} breached stop-writes limit (sys-memory), sys-memory pct:78, memory sz:0 (0 + 0 + 0 + 0) limit:3865470566, disk avail-pct:100 used-pct:0
The Need for a tool (asadm)
To fix the issue, use our new show stop-writes command, available in Aerospike Tools package 8.4.0 (asadm 2.15.0) and later.
When we start asadm, a helpful warning message displays (added in asadm 2.17.0) letting you know that you are in stop-writes and should run show stop-writes for further analysis.
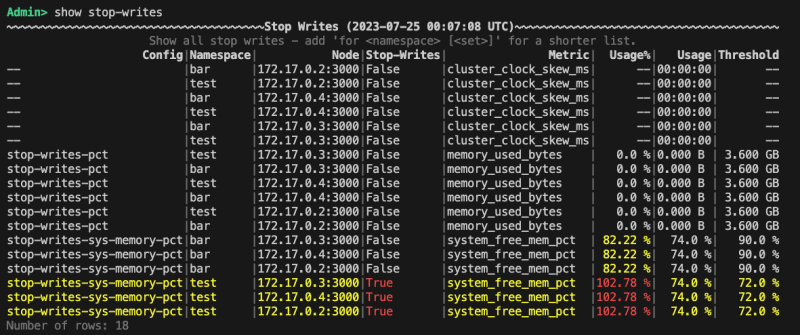
In the table, you'll spot some key details that give us valuable insights into the stop-writes condition. First, the test namespace triggered the stop-writes, and the culprit behind it is the configured stop-writes-sys-memory-pct, set at 72%. By comparing this parameter to the system_free_mem_pct metric, which is at 26%, we can see that the stop-writes were activated when the system reached 74% memory usage.
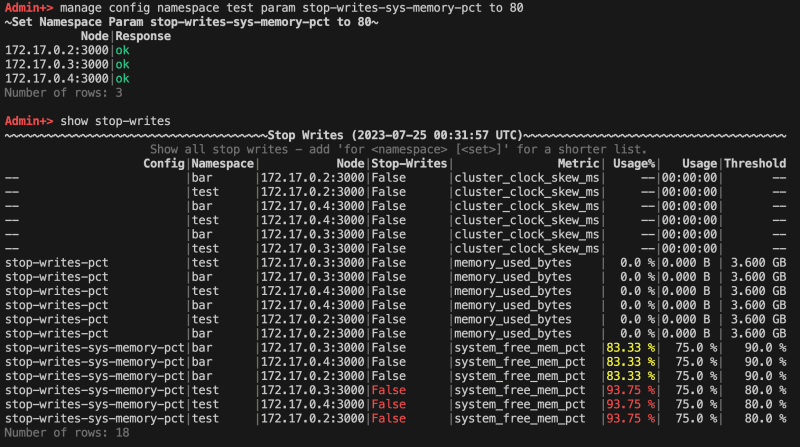
You've got a couple of options to tackle this situation: either increase the memory size allocated for the database or free up some space by removing unnecessary records. Meanwhile, while you work on the permanent fix, you can temporarily raise the configured threshold to get your Aerospike cluster back up and running. So let's do just that using asadm's manage config command.
And voilà! You are now out of stop-writes and can start working on a more permanent solution. Just don't treat the problem like dishes in your sink and leave it for next week.
Learn more about Aerospike Observability & Management
Learn how Aerospike is adopting open standards like YAML, Open Telemetry and how to find clarity in complex systems in our upcoming Webinar - September 6th, 2023.


Top comments (0)