
This article was written by Jeff Stokes. He is a frequent contributor to the Adam the Automator (ATA) blog. If you'd like to read more from this author, check out his ATA author page. Be sure to also check out more how-to posts on cloud computing, system administration, IT, and DevOps on adamtheautomator.com!
Do you rely on Windows Performance Monitor to discover the root cause of Windows performance monitoring issues? Are you still struggling with creating lots of performance monitors at once or simply need a way to automate the process? If so, in this article, you're going to learn how to create perfmon templates and data collector set templates!
In this article, you’ll learn how to do Windows Performance Monitoring by building XML performance monitoring templates to save yourself valuable time.
How Templates Work in Windows Performance Monitoring
Windows Performance Monitor (perfmon) is a native Windows tool for administrators to specify attributes like performance counters, event tracing for Windows events, and system configuration items. Once the attributes are set, perfmon captures data into one of several formats: binary log, SQL, Data Source Name (DSN), or CSV.
Only capture the data you need via performance monitoring. If not, you risk negatively affecting the performance of your servers!

Perfmon captures data from parameters set in data collector sets which control things like the log directory, log schedules, and any stop conditions. It is these data collector sets or groups of parameters that define what to log and when is how you can save time with templates.
Templates, stored as XML, allow you to capture all of the parameters needed to query performance counters and to create data collections. Once you have that template, you can then easily transfer that data collector set to other machines.
You can create perfmon templates from existing data collector sets and can be imported. These tasks are what you're primarily going to learn in this article.
Prerequisites
If you'd like to follow along with this tutorial, please be sure you have the following prerequisites in place.
- Windows Server - We'll be using Windows Server 2019 in this article
- 7-zip to unzip some sample templates
Creating PerfMon Templates
Before you can leverage performance monitor templates for Windows performance monitoring, you must first create them. Creating a template consists of creating a data collector set as usual and then saving the settings as a template. The process is surprisingly simple.
To create a perfmon template, on your Windows Server machine:
- Open up Windows Performance Monitor (perfmon) via perfmon.msc or by opening up via the start menu.
- In the left pane, expand Data Collector Sets and click on User Defined. This allows you to customize the kind of data you'll be collecting.
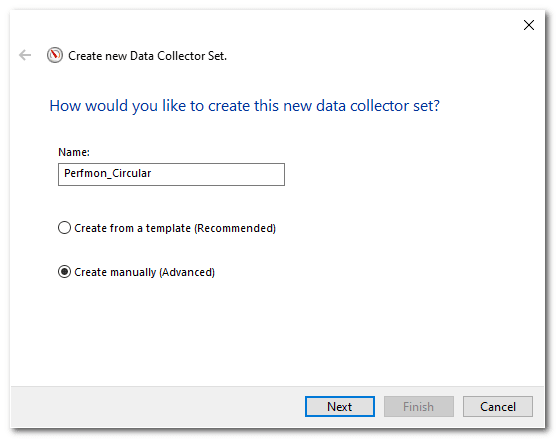
- Right-click on User Defined and click New —> Data Collector Set to open the Create New Data Collector Set window as shown below. Type a Name for your data collector set, click Create manually (Advanced), and click Next. Note the Create from a template (Recommended) option. This is the same place you'll go when importing a template later.
4. In the next screen, you'll be prompted to select what kind of data you'd like to collect as shown below. These options are up to you. Once you do this, click on Finish and your data collector set will be stored directly under User Defined as you'll see in the upcoming screenshot.
Depending on which boxes you clicked, you will be prompted to specify the parameters for Performance counter, Event trace data, and System configuration information. That is a deep dive for another tutorial.

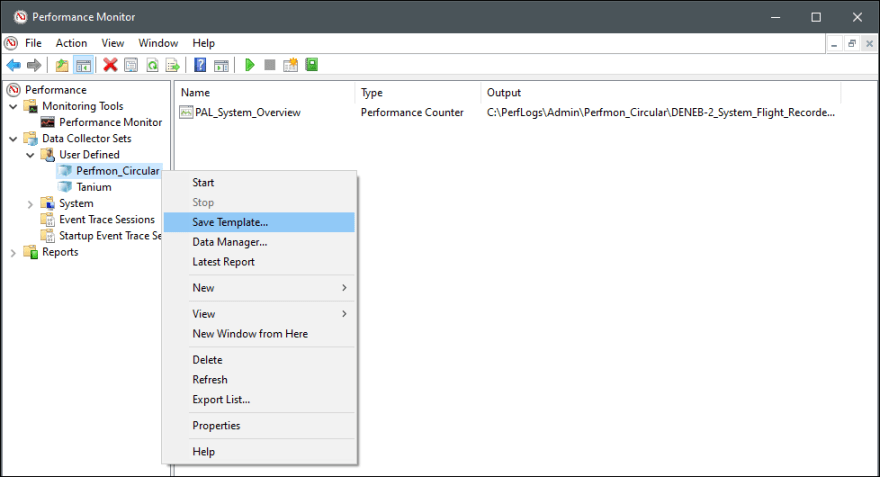
5. As shown below, right-click on the data collector set just created and click Save Template. You will then be prompted where to save the XML file to.
That's it! That's all there is to creating a performance monitoring template. At this point, you can follow the same steps you'll be learning about in the next section to create a data collector set from this template.
Creating a Perfmon Data Collector Set Template
Sometimes it's just faster to start with someone else's vast and learned accomplishments when it comes to Windows performance monitoring. Smugness aside, let's download and use a pre-existing template. The template you'll be using is a base operating system capture. It does not include any performance counter references to applications like Microsoft Exchange or SQL, for example.
When creating a data collector set from template, be sure the computer the data collector set is being created on has the same performance counters as the source computer.
To import the example XML Template into perfmon:
- Go to the GitHub repository, download the performance_capture - rolling 200.7z file and extract it's contents.
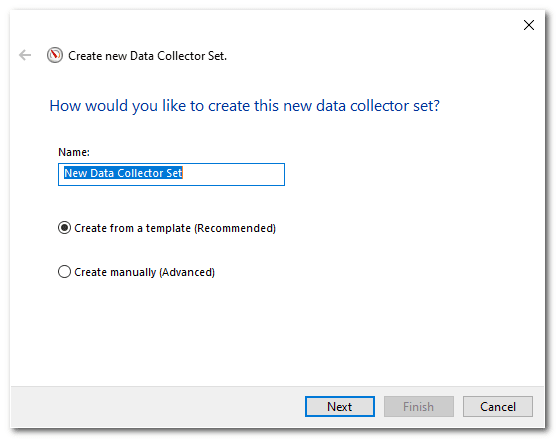
- On Windows Server, open up perfmon, right-click on User Defined and click New —> Data Collector Set to open the Create New Data Collector Set window as shown below. Type the Name for the data collector set and ensure Create from a template (Recommended) is selected and click Next.
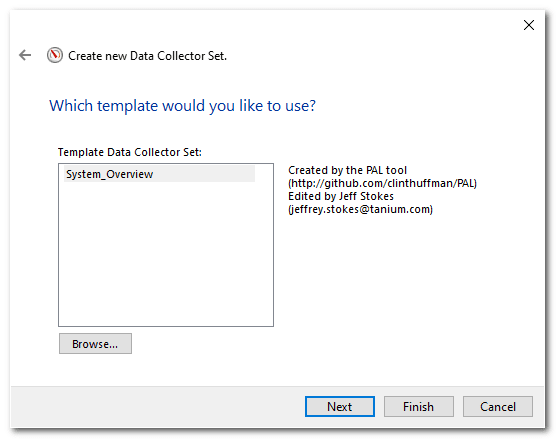
3. The template data collector set in this template example is a Basic one. Choose Basic and click Next. Then click Browse to open the browse window and pick the performance_capture - rolling 200.xml file extracted from the ZIP file earlier.
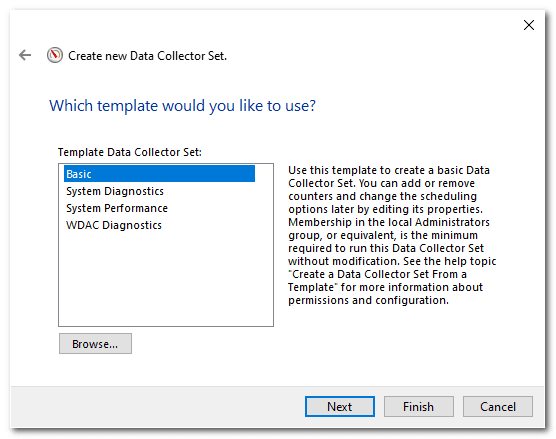
Once the XML template has been selected, perfmon will read the template and provide the template data collector set it found along with any notes in the template as shown below. Click Next.
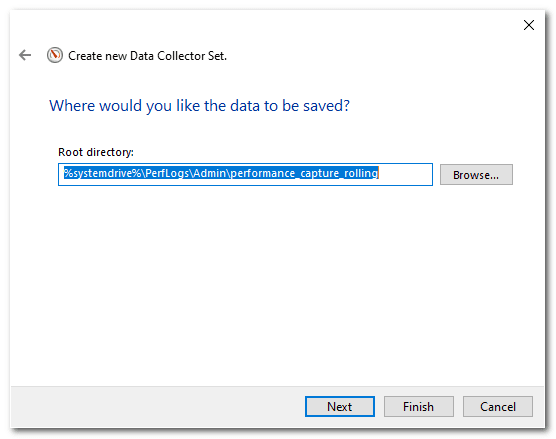
4. Select a place to save the logs generated from this data collector set. You can see below the default path has been selected for you. This path is in the XML template. Leave the default file location as-is and click Next.
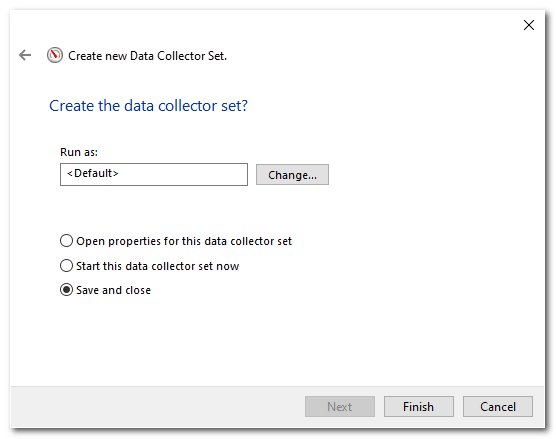
5. Ensure Save and close is selected and click Finish.
You have now created a data collector set from an XML template.
Starting the Data Collector Set
The data collector set is now built from the XML template but it's not doing much at the moment. You have to start the data collector set. To do so:
- Open perfmon if it's not already open.
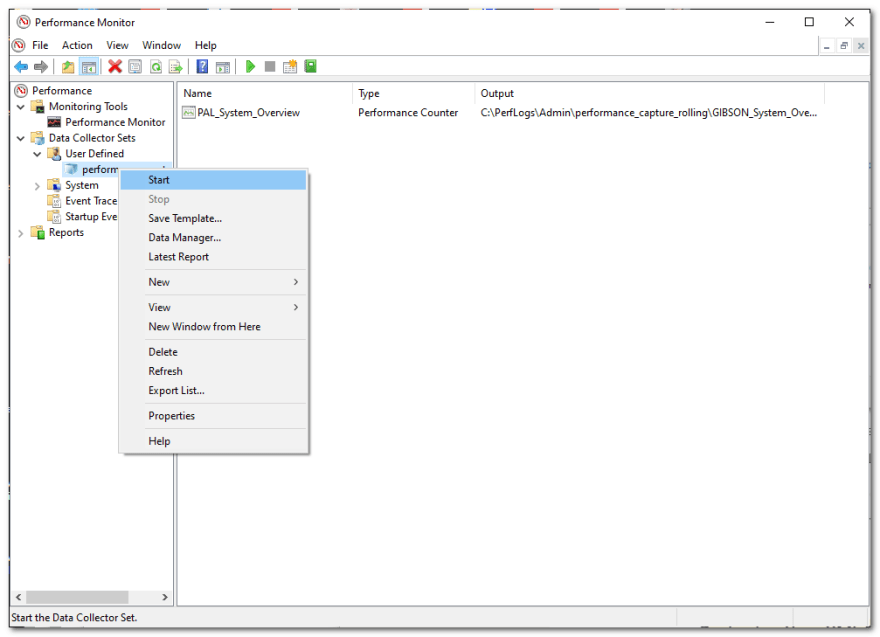
- In the left pane, expand Data Collector Sets —> User Defined. You should now see the data collector set you just created from the template.
- Right-click your custom data collector set and click Start from the pop-up menu as shown below. Performance counters will now begin collecting data.
Reviewing the Created Data Collector Set
Once the data collector set has been created via XML template, you can now inspect the settings to ensure perfmon imported all expected settings.
From permon:
- Expand Data Collector Sets —> User Defined in the left pane.
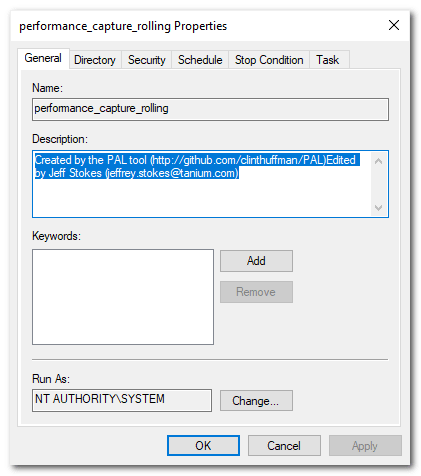
- Right-click the custom data collector set just created and click Properties from the pop-up menu to open the Properties dialog box as you can see below.
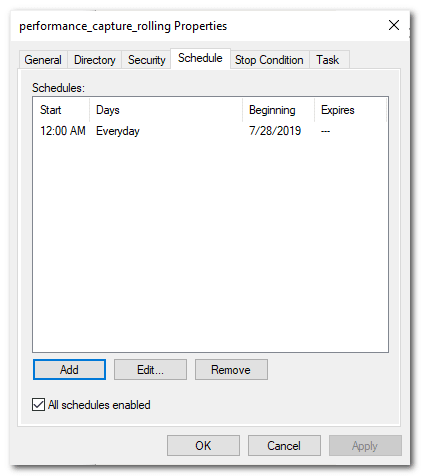
3. Click the Schedule tab. In this tab, verify the Start date is in the past and the checkbox for All schedules enabled is checked. This will make sure your server will resume logging data in the event of a reboot/crash.
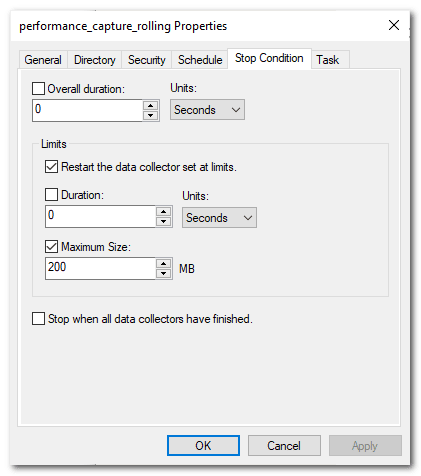
4. Click the Stop Condition tab. Here, verify the Maximum Size of the output file is 200MB as well as the Maximum Size checkbox is checked. Anything larger than 200MB becomes unwieldy.
5. Click OK to close the Properties dialog box.
Reviewing the Data Collector
The XML template creates a data collector set but inside of that set are individual data collectors. You should also inspect the data collector created by the template. To do that:
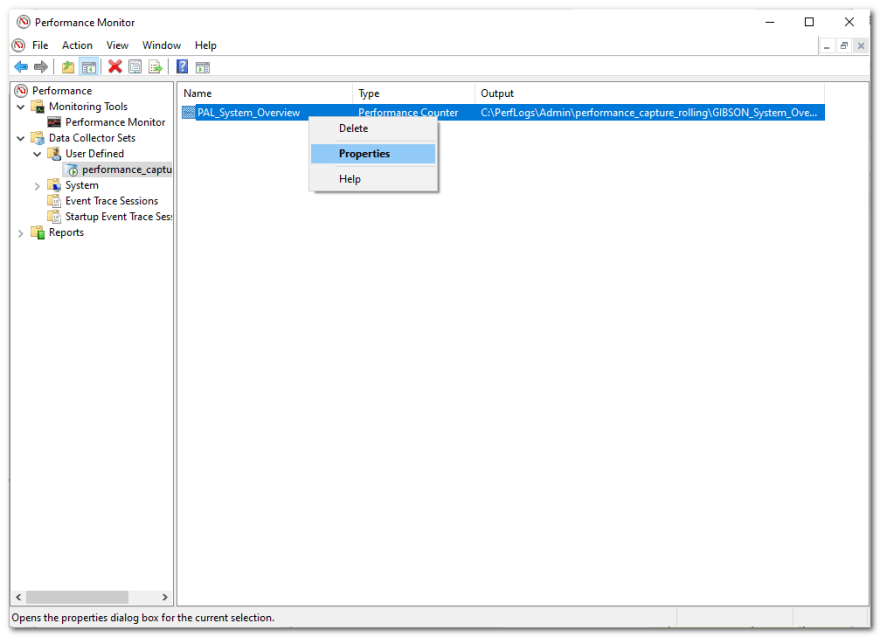
- Select the data collector in the middle pane, right-click, and click Properties from the pop-up menu as shown below.
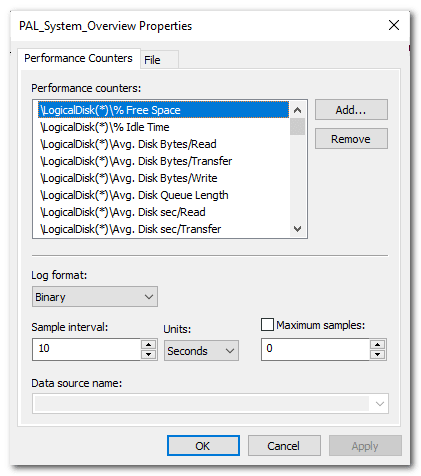
2. In the Performance Counter Properties dialog box, ensure the Performance Counters tab is selected as shown below.
For this exercise, we are just taking a peek. Note the Performance counters being collected. In the future you can add or remove them to suit your needs. Also note the Log format is binary (BLG). Unlike tab or comma-separated value file output, BLG has a dynamic schema. This is helpful if a process starts after the log starts, it will still be included in the log file. Also notice the sample rate on this tab.
3. Click the File tab. In this box, the Log mode should be Circular. This mode captures the last several hours of the systems' activity and is written in a first-in, first-out method.
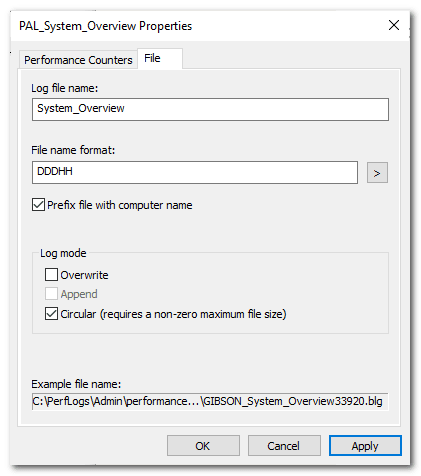
4. Click OK to close the Properties dialog box and you're done!
Wrapping up Perfmon Templates
Using performance monitoring templates to create data collector sets is a convenient way to manage performance counters at scale or via automation. You've now seen an example of using templates. Armed with that knowledge, how do you plan to use templates in your day-to-day tasks?

Top comments (0)