
Telemetry is becoming the defacto library to instrument and publish
metrics in Elixir apps. This post is a step-by-step guide to integrate
Telemetry in a Phoenix app which leverages Opus.
What is Telemetry
Telemetry is a dynamic dispatching library for metrics and instrumentations.
It is lightweight, small and can be used in any Erlang or Elixir project.
Project page: https://github.com/beam-telemetry/telemetry
Instead of every library / framework having its own way of publishing
metrics, the ecosystem is gradually converging on using Telemetry.
How it Works
You may attach event handlers which are stored in an ETS table. When an
event is emitted, all matching event handlers are called. Due to the
fact that handlers are called synchronously, you should make sure they
are fast, so not to cause bottlenecks.
Example
- Set up a handler which logs to the console
Start an IEx session with iex, then run:
# Install telemetry (Mix.install requires Elixir > v1.12)
Mix.install([:telemetry_metrics])

# Attach a uniquely named handler which prints measurements
:telemetry.attach("example-handler",
                  [:example, :metric, :done],
                  (fn _metric, measurements, _meta, _config ->
                    IO.inspect measurements
                  end),
                  nil)
- Emit an event
:telemetry.execute [:example, :metric, :done], %{latency: 1337}, %{}
- See the output
You should see %{latency: 1337} in the output.
How it Works
:telemetry.attach/4 inserts an object in an ETS table named telemetry_handler_table.
We can inspect the table to verify this:
:ets.tab2list(:telemetry_handler_table)

#=> [
#=>   {:handler, "example-handler", [:example, :metric, :done],
#=>   #Function<5.126501267/4 in :erl_eval.expr/5>, nil}
#=> ]
When an event is emitted, the process emitting the event will call all
the event handlers matching the given event name. To list the matching
handlers, you can call:
:ets.lookup :telemetry_handler_table, [:example, :metric, :done]

#=> [
#=>   {:handler, "example-handler", [:example, :metric, :done],
#=>   #Function<5.126501267/4 in :erl_eval.expr/5>, nil}
#=> ]
Phoenix Telemetry
If you're building a Phoenix application, you're in luck. Since v1.5, new Phoenix applications are generated
with a Telemetry supervisor. Many popular libraries emit telemetry
events and you can easily visualize events in LiveDashboard.
Opus Telemetry
Opus is a library to build "service modules".
Consider the following pipeline module:
defmodule Example.GenerateSession do
  use Opus.Pipeline

  check :valid?, with: &match?(%{user_id: uid} when is_integer(uid), &1)
  step :generate, with: &"session-#{&1.user_id}"
end
You can call this module with:
Example.GenerateSession.call %{user_id: 1337}

# => {:ok, "session-123"}
Wouldn't it be ideal to publish metrics for the duration of each step as
well as the total duration?
Thankfully, Opus supports defining instrumentation modules, but you can
also define instrumentation functions inline.
To emit telemetry events, add the following module in your codebase:
defmodule Example.OpusTelemetry do
  require Logger

  def instrument(:pipeline_started, %{pipeline: pipeline}, %{input: _input}) do
    :telemetry.execute(
      [:opus, :pipeline, :start],
      %{time: System.system_time()},
      %{pipeline: inspect(pipeline)}
    )
  end

  def instrument(:stage_completed, %{stage: %{name: name, pipeline: pipeline}}, %{time: time}) do
    :telemetry.execute(
      [:opus, :pipeline, :stage, :stop],
      %{duration: time},
      %{pipeline: inspect(pipeline), stage: name}
    )
  end

  def instrument(:pipeline_completed, %{pipeline: pipeline}, %{result: {:ok, _}, time: time}) do
    emit_stop(%{pipeline: pipeline, success?: true, duration: time})
  end

  def instrument(:pipeline_completed, %{pipeline: pipeline}, %{result: {:error, _}, time: time}) do
    emit_stop(%{pipeline: pipeline, success?: false, duration: time})
  end

  def instrument(_event, _, _) do
    :ok
  end

  defp emit_stop(%{pipeline: pipeline, success?: success?, duration: duration}) do
    :telemetry.execute(
      [:opus, :pipeline, :stop],
      %{duration: duration, success: success?},
      %{pipeline: inspect(pipeline)}
    )
  end
end
📣 The next version of Opus, will provide an Opus.Telemetry module, and
you won't need to copy-paste code into your app.
Next, update your config/config.exs with:
config :opus, :instrumentation, [Example.OpusTelemetry]
We can first set up a very simple handler to verify that instrumentation
is configured correctly. In an IEx session run:
require Logger

:telemetry.attach "opus-test",
                  [:opus, :pipeline, :stop],
                  (fn _, m, _, _ -> Logger.info inspect(m) end),
                  nil
Then call the sample pipeline a few times:
iex(16)> Example.GenerateSession.call %{user_id: 1337}
# 20:40:43.164 [info] %{duration: 15000, success: true} 👈 Printed by the handler
{:ok, "session-1337"}

iex(21)> Example.GenerateSession.call %{user_id: 42}
# 20:40:43.164 [info] %{duration: 17000, success: true}
{:ok, "session-42"}

iex(22)> Example.GenerateSession.call %{user_id: "invalid"}
# 20:40:43.164 [info] %{duration: 19000, success: false}
{:error,
 %Opus.PipelineError{
   error: :failed_check_valid?,
   input: %{user_id: "invalid"},
   pipeline: Example.GenerateSession,
   stacktrace: nil,
   stage: :valid?
 }}
It works! 🙌
Moving on to configure our metrics in our Phoenix app so that we can graph then in LiveDashboard.
# TODO: Add the code in ExampleWeb.Telemetry module
Any recently generated Phoenix application (after v1.5) will already
have a Telemetry supervisor, which looks like this:
defmodule ExammpleWeb.Telemetry do
  use Supervisor
  import Telemetry.Metrics

  def start_link(arg) do
    Supervisor.start_link(__MODULE__, arg, name: __MODULE__)
  end

  @impl true
  def init(_arg) do
    children = [{Telemetry.Metrics.ConsoleReporter, metrics: metrics()}]

    Supervisor.init(children, strategy: :one_for_one)
  end

  def metrics do
    [
      # Phoenix Metrics
      summary("phoenix.endpoint.stop.duration",
        unit: {:native, :millisecond}
      ),
      summary("phoenix.router_dispatch.stop.duration",
        tags: [:route],
        unit: {:native, :millisecond}
      )
    ]
  end

  defp periodic_measurements do
    []
  end
end
What you need to do is to change the metrics method above to include
the Opus metrics you wish reported:
def metrics do
  [
    # Phoenix Metrics
    summary("phoenix.endpoint.stop.duration",
      unit: {:native, :millisecond}
    ),
    summary("phoenix.router_dispatch.stop.duration",
      tags: [:route],
      unit: {:native, :millisecond}
    ),

    # 👇 Add these two
    counter("opus.pipeline.start.time",
      description: "Pipeline Started",
      tags: [:pipeline]
    ),
    summary("opus.pipeline.stop.duration",
      description: "Pipeline Duration",
      tags: [:pipeline],
      unit: {:native, :millisecond}
    )
  ]
end
One thing to notice is how the first argument to metric functions is constructed:
"opus.pipeline.stop.duration"

[:opus, :pipeline, :stop]      :duration
<----- event name ------>  <-- measurement -->
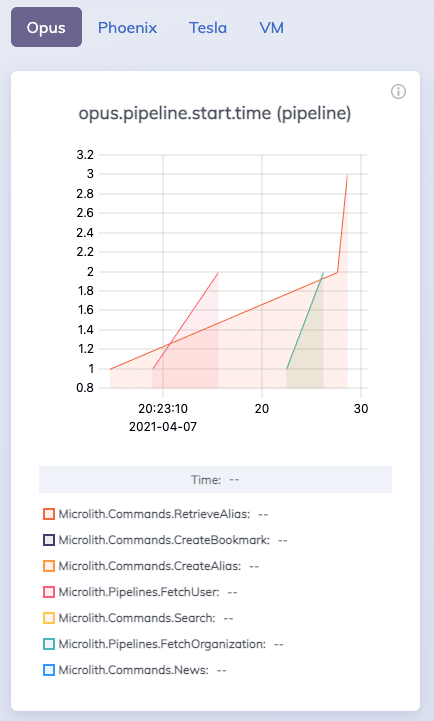
Live Dashboard
Time to fire up the Phoenix server and point the browser to the dashboard:
http://localhost:4000/dashboard/metrics?nav=opus
Upcoming Blog post
There's so much to cover in a single post.
In the next post, I'll to write about:
- Creating a custom LiveDashboard page to visualize pipelines (think opus_graph)
- Reporting Telemetry events to DataDog
Further Reading
- Telemetry Documentation
- Telemetry.Metrics Documentation
- Opus Documentation
- Tips for Finch and Telemetry - Claudio Ortolina
banner image by Johannes Groll - unsplash


Top comments (0)