Tidy Tuesday — Tuition Data
Tidy Tuesday is a weekly mini data science challenge. Its a great way to practice your data analytics skills without feeling overwhelmed. The data sites are published on Monday and on Tuesday people share what they have done on Twitter with the #tidytuesdays. I’ve seen people share some amazing graphics. Even though it’s associated with the R community you are free to use any tech stack you want.
In this blog post, I’m going to analyze the US Tuition Costs tuition dataset which was published in the repo in 2018. Before I begin you should know the characteristics of a tidy dataset.
A reminder of these characteristics
- Each variable must have its own column.
- Each observation must have its own row.
- Each value must have its own cell.
If you want a deeper dive into getting started on doing tidy analyzes please read my previous blog.
Before I write a line of code I like to get to know the dataset. Each tidy Tuesday data set comes with a link to its source and an article. So I review the article beforehand. Next, it's time to import the data and look at the data structure.
library('tidyverse')
library('readxl')
library('here')
tuition <- read_excel('us_avg_tuition.xlsx')

glimpse(tuition)
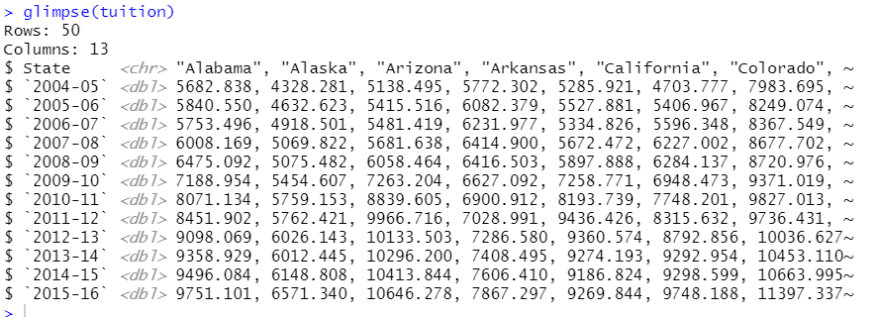
This is a quick glimpse of the data frame. It has 50 rows representing each state in the US and columns that represent years from 2004- 2016. This dataset is not tidy dataset. This data sets breaks the first rule of being tidy.
- Each variable must have its own column.
The years of the dataset should be in one column. It should not be spread out in multiple columns. We will pivot this table in order to accomplish this. Also, notice how the year column is labeled 2004–05. It will be a pain in the butt to reference this column this way. So let's take away the dash and the last two digits of the year using some regex. If you want to learn more about regex please look at my blog post REGEX 101.
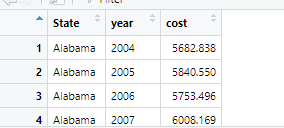
tidy_tuition <- tuition %>%
  pivot_longer(-State,names_to="year",values_to="cost") %>%
  mutate(year = gsub("\\-\\d+$","",year))
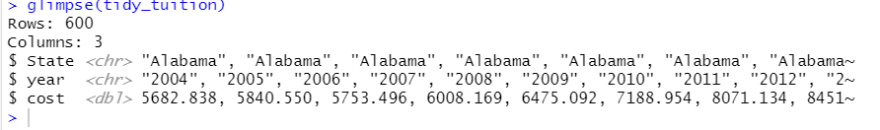
Year is now of type string. I prefer it to be of an integer data type.
tidy_tuition$year <-as.integer(tidy_tuition$year)
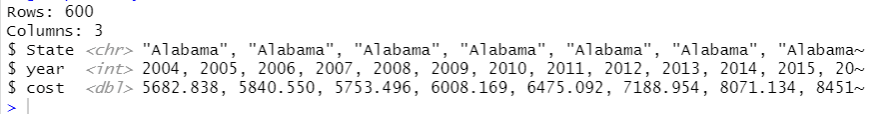
Now, this is a tidy dataset. We can now use functions from the tidyverse in order to conduct our analysis. Next, I come up with questions.
Questions
Which state had the cheapest tuition in 2015?
Which state had the most expensive tuition in 2015?
What is Illinois tuition from 2004 -2016
Can I make a linear regression model to accurately predict tuition in the state of Illinois
Let's see if I can answer my questions.
Which state had the cheapest tuition in 2015?
Which state had the most expensive tuition in 2015?
latest_cost <- tidy_tuition %>%
  filter(year == 2015)

latest_cost[which.min(latest_cost$cost),]

latest_cost[which.max(latest_cost$cost),]
Wyoming has the cheapest tuition in the year 2015 with a cost of $4,891.
New Hampshire has the highest cost of tuition in 2015 with the cost of tuition being $15,160.
What is Illinois tuition from 2009 -2015?
illinois_cost <- tidy_tuition %>%
  filter(State == "Illinois")

ggplot(illinois_cost,aes(x=year,y=cost)) +geom_line()

Can I make a linear regression model to accurately predict tuition in the state of Illinois?
We are going to make a linear regression model from the Illinois subset of the tidy_tuition data set.
future_cost <- lm(cost ~ year, data = illinois_cost)
summary(future_cost)

predicted_cost <- predict(future_cost, illinois_cost)

illinois_cost %>% mutate(prediction = predicted_cost)
future_cost variable is our linear regression model.
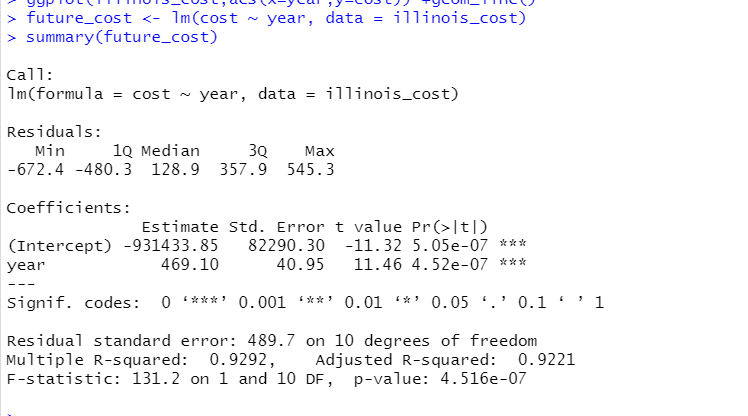
Overall year is a pretty significant variable that determines the cost of tuition in Illinois. Each that passes it seems to be about a $469.10 increase with tuition cost.
Now let's compare the actual cost with the predicted cost.
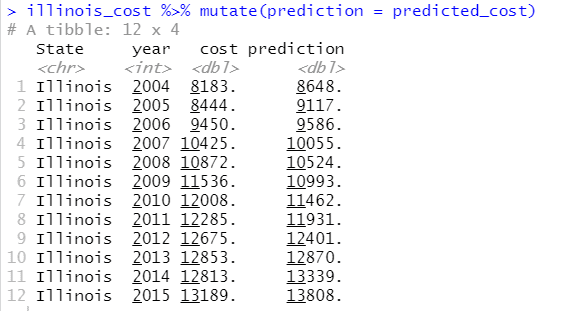
Visually the prediction of the model is not too far off from the actual cost.


Latest comments (0)