Let's get real -- as developers, we spend a significant amount of time staring at a screen and trying to figure out why our code isn't working. According to Coralogix, there are an average of 70 bugs per 1000 lines of code. That's a solid 7% worth of blimps, bumps, and bugs. In addition to this, fixing a bug can take 30 times longer than writing an actual line of code. But it doesn't have to be this way. If you're using IntelliJ (or are thinking about making the switch to it), the in-built debugger and its shortcuts can help speed up the process. But first, what is IntelliJ?
What is IntelliJ?
If you're looking for a great Java IDE, you should check out IntelliJ IDEA. It's a robust, feature-rich IDE perfect for developing Java applications. While VSCode is excellent in many situations, IntelliJ is designed for Java applications. Here's a quick overview of IntelliJ IDEA and why it's so great.
IntelliJ IDEA is a Java IDE developed by JetBrains. It's a commercial product, but a free community edition is available. Some of the features include:
- Intelligent code completion
- Refactoring
- Code analysis
- Support for various frameworks and libraries
- Great debugger
Debugging code in IntelliJ
If you're a developer, you will have to debug code sooner or later. But what exactly is debugging? And why do we do it?
Debugging is the process of identifying and removing errors from a computer program. Errors can be caused by incorrect code, hardware faults, or software bugs. When you find a bug, the first thing you need to do is to try and reproduce the bug so you can narrow down the problem and identify the root cause. Once you've reproduced the bug, you can then start to debug the code.
Debugging is typically done by running a program in a debugger, which is a tool that allows the programmer to step through the code, line by line. The debugger will show the values of variables and allow programmers to change them so they can find errors and fix them.
The general process of debugging follows this flow:
- identify the bug
- reproduce the bug
- narrow down where in the code the bug is occurring
- understand why the bug exists
- fix the bug

Most often than not, we spend our time on the second and third steps. Statistically, we spend approximately 75% of our time just debugging code. In the US, $113B is spent on developers trying to figure out the what, where, why, and how of existing bugs. Leveraging the IDE's built-in features will allow you to condense the debugging process.
Sure, using a debugger will slow down the execution of the code, but most of the time, you don't need it to run at the same snail's pace speed through the entire process. The shortcut controls allow you to observe the meta inner workings of your code at the rate you need them to be.
Without further ado -- here are the top 8 IntelliJ debug shortcuts, what they do and how they can help speed up the debugging process.
Top 8 IntelliJ Debug Shortcuts
1. Step Over (F8)
Stepping is the process of executing a program one line at a time. Stepping helps with the debugging process by allowing the programmer to see the effects of each line of code as it is executed. Stepping can be done manually by setting breakpoints and running the program one line at a time or automatically by using a debugger tool that will execute the program one line at a time.
Step over (F8) takes you to the following line without going into the method if one exists. This step can be helpful if you need to quickly pass through the code, hunt down specific variables, and figure out at what point it exhibits undesired behavior.

2. Step into (F7)
Step into (F7) will take the debugger inside the method to demonstrate what gets executed and how variables change throughout the process.
This functionality is helpful if you want to narrow down your code during the transformation process.

3. Smart step into (Shift + F7)
Sometimes multiple methods are called on the line. Smart step into (Shift + F7) lets you decide which one to invoke, which is helpful as it enables you to target potential problematic methods or go through a clear process of elimination.

4. Step out (Shift + F8)
At some point, you will want to exit the method. The step out (Shift + F8) functionality will take you to the call method and back up the hierarchy branch of your code.
5. Run to cursor (Alt + F9)
Alternative to setting manual breakpoints, you can also use your cursor as the marker for your debugger.
Run to cursor (Alt + F9) will let the debugger run until it reaches where your cursor is pointing. This step can be helpful when you are scrolling through code and want to quickly pinpoint issues without the need to set a manual breakpoint.
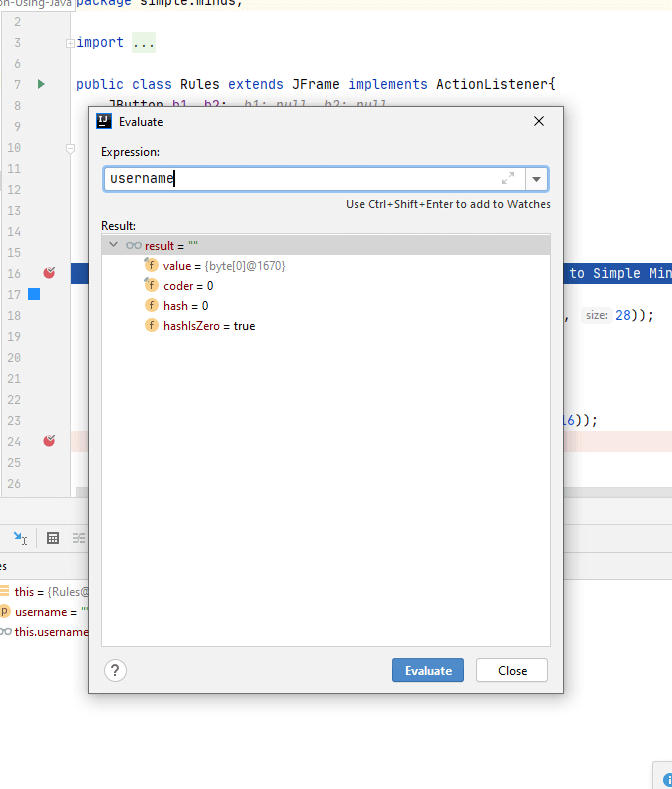
6. Evaluate expression (Alt + F8)
It's one thing to run your code at the speed you need; it's another to see what's happening at each step. Under normal circumstances, hovering your cursor over the expression will give you a tooltip.
But sometimes, you just need more details. Using the evaluate expression shortcut (Alt + F8) will reveal the child elements of the object, which can help obtain state transparency.
7. Resume program (F9)
Debugging is a constant stop and start process. The ability to toggle this process is achievable through F9. This shortcut will kickstart the debugger back into gear and get it moving to the next breakpoint.
For Mac, a keycord (Cmd + Alt + R) is required to resume the program.
8. Toggle (Ctrl + F8) & view breakpoints (Ctrl + Shift + F8)
Breakpoints can get nested inside methods -- which can be a hassle to look at if you want to step out and see the bigger picture. This is where the ability to toggle breakpoints comes in.
You can toggle line breakpoints with Ctrl+F8. Alternatively, if you want to view and set exception breakpoints, you can use Ctrl+Shift+F8.
For Mac OS, the keycords are:
- Toggle -- Cmd + F8
- View breakpoints -- Cmd + Shift + F8
Improving the debugging process
If you're a software engineer, you know that debugging is essential for the development process. It can be time-consuming and frustrating, but it's necessary to ensure that your code is working correctly.
Fortunately, there are ways to improve the debugging process, and one of them is by using Lightrun. Lightrun is a cloud-based debugging platform you can use to debug code in real-time. It is designed to make the debugging process easier and more efficient, and it can be used with any programming language.
One of the great things about Lightrun is that you can use it to debug code in production, which means that you can find and fix bugs in your code before your users do. Lightrun can also provide a visual representation of the code being debugged. This can help understand what is going on and identify the root cause of the problem. Give it a try today.


Oldest comments (0)