Learn how we debug our backend servers and provide fast updates without breaking deployments.

Jump To Topic
Mark Zuckerberg famously quipped that Facebook works under the "Move fast and break things" motto. We can write all the unit tests in the world, have the largest QA pipeline but still bugs slither into production. That's just a fact of life which he chose to celebrate.
When dealing with an incredibly complex system like we have in Codename One this can be the difference between releasing an update and doing nothing.
If you are a visual learner check out the following video:
Disaster Strikes
The problem with this approach becomes apparent when we have a bug in production. Normally, a bug that would go through staging, QA and tests wouldn't be too horrible... But since it's a production only bug you're often faced with two options:
- Revert --- That might not be an option for all cases\
- Find/Implement a Fix
Notice that I left out "reproduce it locally". This is often not an option for production bugs which work on a separate DB in "real world" conditions. In our case local debugging is very difficult due to the multiple separate servers that hand off tasks to one another.
The second option is usually best but it includes a huge risk: what if the fix fails?
Since production deployment is often a slow process that requires a QA cycle this compounds the problem. You make a fix then have to wait for hours only to find out that you got it wrong... This used to be us.
Enter Lightrun
So a couple of years ago I met two young founders who had an idea on how to solve this problem. Essentially, it's a new kind of debugger that works very differently from a regular debugger.
The gist of this is that your app constantly runs in a production debugging mode, the overhead is barely noticeable. A secure agent connects the app to the cloud and lets you debug in a special way.
e.g. instead of breakpoints you have snapshots. They don't "break". They provide you with a stack trace of the thread and the variable state at the given time. You can also inject log statements, count executions and even do simple profiling on methods or blocks of code.
I was so impressed by this idea that I decided to join the team and now hold two jobs (at Codename One and at Lightrun). The cool thing is that my job at Codename One is now much easier thanks to Lightrun.
Bugs in Production...
90% of my work at Codename One is putting out fires. A subscriber writes to our support complaining about a failure of a build or push servers etc. This used to be very hard to debug. We would spend hours reading huge logs and guessing
Then we'd deploy additional logs, ask the user to send a new build and then reread the logs to figure out what the hell went wrong. Some of the guessing is always there but with Lightrun the whole process is practically instant.
With Lightrun we can just set a conditional snapshot e.g.
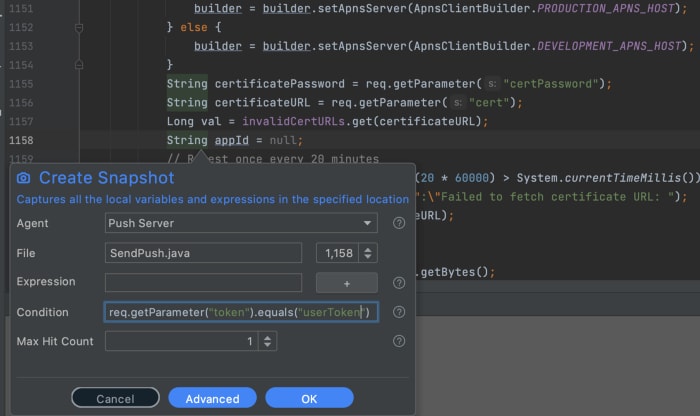
Debugging a failure in push
In the case above I can grab a snapshot when a specific user sends a push. This is a conditional breakpoint, that's a useful tool when debugging locally. It's an indispensable tool when debugging in production. We only want to see the information related to a specific user and not all users...
When the snapshot hits we end up with a stack trace similar to this one (I blacked out private information in the image).

Snapshot Stack
Notice that a Snapshot looks just like a regular breakpoint. It's missing the threads and you can't step over. But you can walk the stack and inspect the values of fields/variables etc. when the application is still running... Pretty darn useful!
Instead of stepping over you can just add multiple snapshots or even inject logs to print information when hitting a specific line. Including simple expressions such as: The value is {obj.getValue()}.
My immediate thought was "won't this be expensive?".
It isn't. If we have a very complex/expensive expressions that prints too much per second or uses problematic (e.g. recursive) logic, Lightrun is smart enough to limit itself so the expression won't take too much CPU. It protects you from shooting yourself in the foot...
As a result of that there's no noticeable performance overhead and you can work without worrying. But I digress, lets go back to the push server example above.
Unexpected Bug
When I started this post I wanted to reproduce a debugging session for a user problem but as I was grabbing the screenshots for the session I noticed something weird in the stack. The value of subscriptionLevel was gibberish. It was way too large.
Turns out we had a bug in reading the user subscription level when sending push messages. That meant that quotas and rate limits weren't applied at all in our push server!
I'm sure we lost income because of this bug, users whose subscription elapsed could still send push messages at volume without a problem. Ugh!
This is one of the coolest benefits of Lightrun, it lets you see clearly into the running system and verify your expectations.
Expected User Problem
The real problem I debugged relates to that line above. A user stopped getting iOS push messages. I just placed a Snapshot (AKA breakpoint) with his token, then inspected the values sent to the push server.
I could then see the URL of the push certificate and could instantly verify that it expired. This was easier to do than debugging locally!
The Deeper Pipeline
User issues are very important but issues that no one is aware of are possibly even more important...
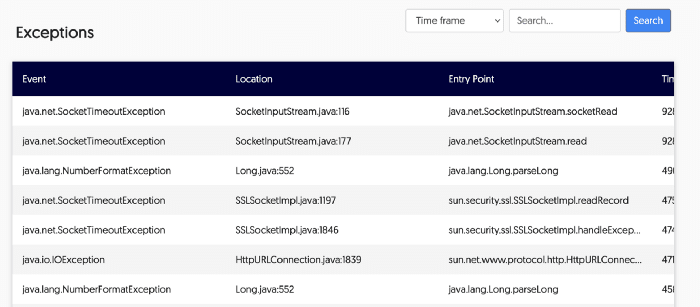
Exception Monitoring
Lightrun also provides a way to detect exceptions (caught or uncaught). We can review the stack traces periodically to see if there are errors that we didn't detect.
This isn't a unique feature to Lightrun, but it fits perfectly as you can easily trace a problem you saw in the stack traces.
Metrics
Lightrun also includes metrics such as counters, tictocs and method duration measurements.
This is super useful for micro-benchmarks in production but we don't need this as much in Codename One. Our backend is relatively simple and these never came up.
Installing Lightrun
So, there has to be a downside right?
Installing the plugin in the IDE and signing up is very easy... But agent setup is still challenging. I spent a lot of time trying to get it to work on all our servers.
Admittedly the Codename One architecture is pretty complex filled with a lot of legacy and pre-docker deployment choices. Prepare yourself for a bit of work. It might be trivial but you might need some help from the web chat support channel (which is super responsive).
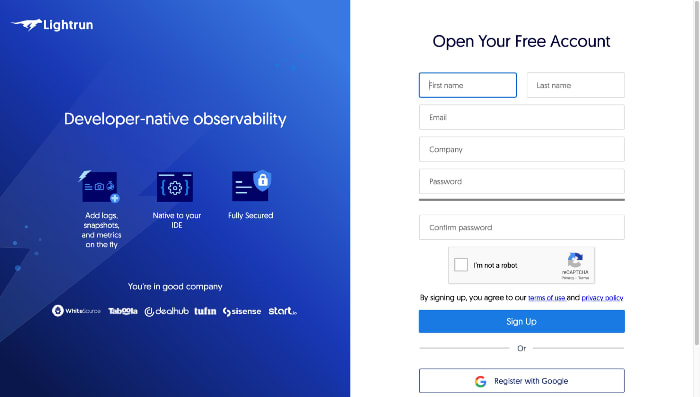
Signup Page on app.lightrun.com
Once you sign up at https://app.lightrun.com/ you get a wizard that verifies you performed the steps correctly:
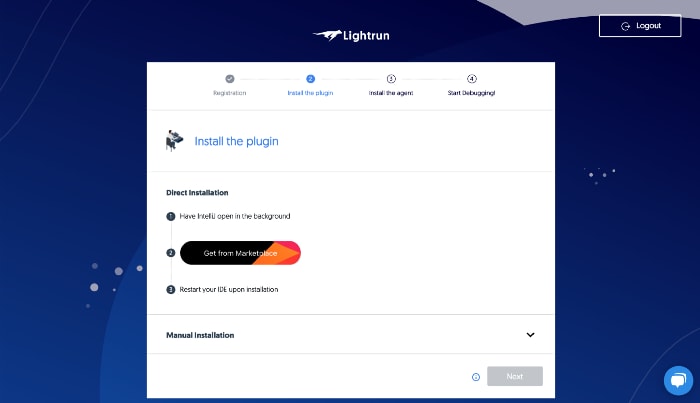
Install the Plugin and Login
To pass the first step you need to install the IntelliJ plugin from the marketplace.
You then need to restart the IDE, open the Lightrun tool window on the right hand side and press the login button.
Once logged in, the Next button in the wizard will become enabled and you could move on to the agent installation step. This is the hard part...
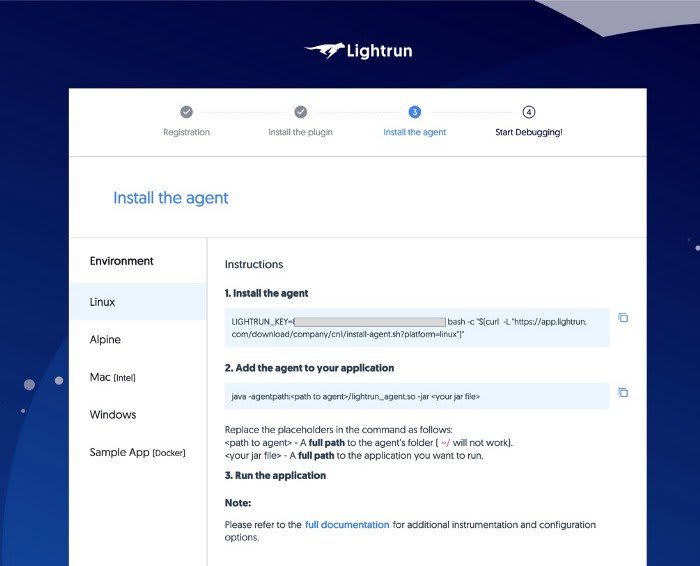
Agent Install instructions, notice I erased private information
The agent is typically installed on your server and not on your local machine. So when I reached this page "Mac" was selected. I had to explicitly select the Linux page and copy the script that installs the agent on Linux machines.
The next step is to SSH to the machine and run the script. It creates an "agent" directory which we'll use when binding the agent.
The gist of this is that we need to add the -agentpath argument to the JVM. That's very simple if your deployment has a "java" command invocation at some point but if your running as a service or within a container that might not be so simple.
Once you do that the "Next" option will be enabled and you would be able to use Lightrun.
But there are more complex cases, I would recommend reviewing the list here.
One example is our older Tomcat server used for push. I had to edit catalina.sh and add something like this:
="$JAVA_OPTS -agentpath:/home/username/agent/lightrun_agent.so= --lightrun_extra_class_path=/home/username/apache-tomcat/webapps/myapp.war"
Copy
Notice the extra option of --lightrun_extra_class_path (that's 2 minus signs) which we use to explicitly state the classpath. You might need that if things aren't auto-detected properly. This let the agent run but I got no variables in my stack traces... Turns out I had to recompile the code with full debug options turned on -g. This was a bit of a challenge in Maven. The solution was to add these properties:
<properties><maven.compiler.debug></maven.compiler.debug><debug></debug><debugLevel></debugLevel><maven.compiler.debuglevel></maven.compiler.debuglevel></properties>
Copy
You can test that -g is missing using code like this:
-Project//-.ClassName|LocalVariableTable
Copy
If this prints nothing then the class doesn't contain debug information.
Again, this is an involved process. I strongly suggest engaging support while going through it.
TL;DR
The reason we don't rush to production is the tedious and slow process of fixing production issues. But this creates an overly complex multi-branch support structure that ends up making matters worse.
If we can debug quickly in the production and fix right away our overall stability increases while keeping a low overhead.
IMO Deploying a server today without debugging tools is akin to coding without an IDE. You can do that but you're missing out on modern advancements in our field.


Oldest comments (0)