In this blog, I will briefly explain some of the most commonly asked machine learning models in interviews. I will also list important parameters related to each model and a source to find a detailed explanation of the same topic, so you can dig deeper if and when required.
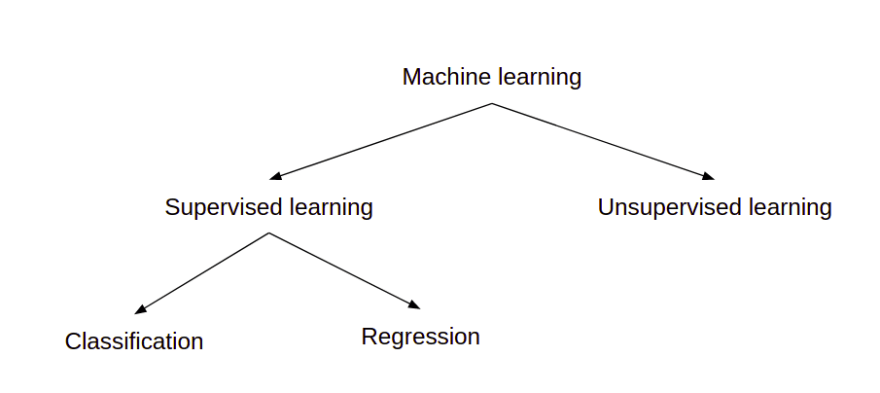
Machine learning models can be broadly categorized into two categories supervised and unsupervised learning. Further in supervised learning, we have two broad categories regression and classification. The following sections explain each of them briefly to give you the necessary insights.
Note: I am providing models, which I believe are the most common ones and should be prepared before giving any data science interview. However this list is subjective.
Supervised learning
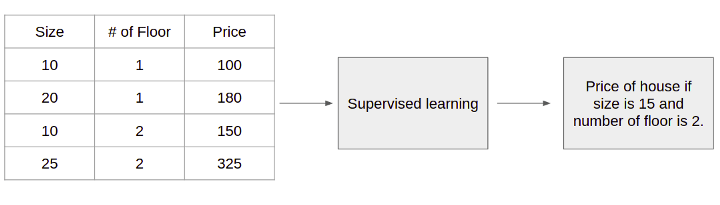
In supervised learning, the data that you use for training the models is “labeled”. This means the output for each input is known. For example, if your model is trying to predict house prices, you might have variables like size of the house, number of floors, etc. When your data is labeled, it means you would also have a variable that contains the house price.
The above example was for regression. Let’s have a close look at regression and classification now.
Classification
In classification, the output of the model is discrete. For example, consider dog vs cat image classification, where we predict whether the image contains the family of dogs or cats. The class (which is the output of the model) will be discrete here i.e. either dog or cat. Now, we will look through the models which are commonly used for classification.
Logistic regression
Don’t get confused; it has the word “regression” in the name, but it is used for classification. Logistic regression uses an equation to create a curve with your data and then uses this curve to predict the outcome of a new observation.
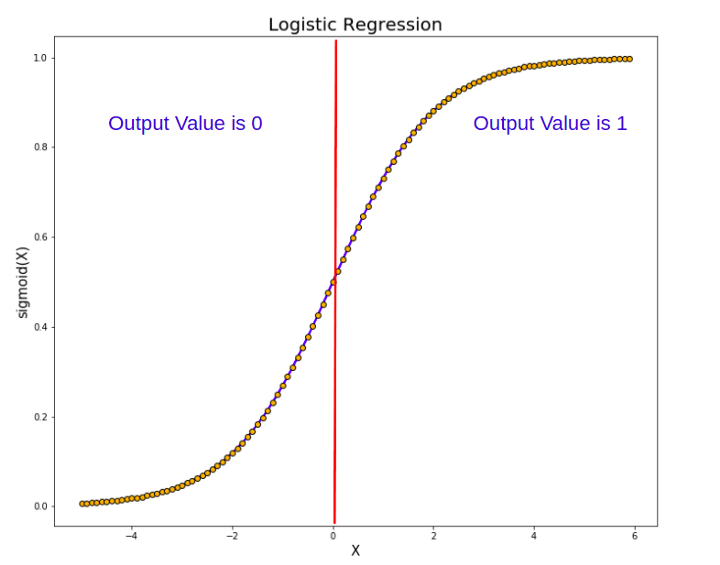
In essence, a logistic equation is created so that the output values can only be between 0 and 1.
Support Vector Machine
Support Vector Machines (SVM) form a boundary between data points for classification. For example, in the case of 2 dimensions, SVM will create a boundary such that the majority of data points of one class fall on one side of the boundary, and most of the other class falls on the other side.
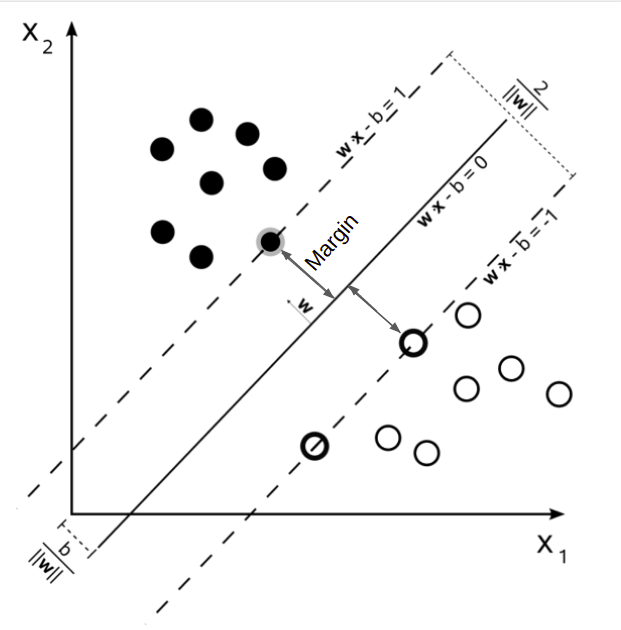
So the goal in SVM is to find the boundary which maximizes the margin (described in the above image).
Important Parameter/Concepts — Kernel, C, Gamma, Margin

Decision Tree
In the decision tree, you basically ask questions about your observation and follow the tree down until you reach an outcome, as shown below.
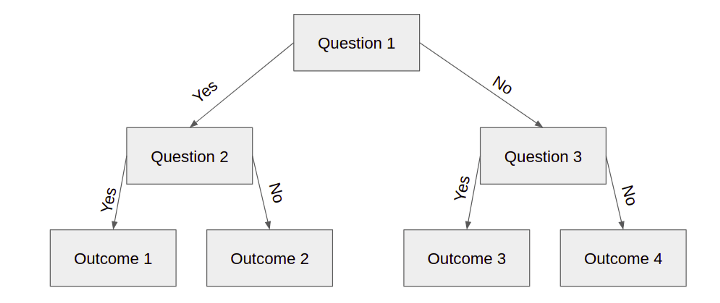
In the above example, each square is called a node, and more number of nodes here will cause more overfitting of the model on the dataset.
Important Parameter/Concepts — Node, Leaf Node, Entropy, Information Gain
Random Forest
It is an ensemble learning technique that uses multiple decision trees to give the final output. Random forests create multiple decision trees based on bootstrapped datasets of the original dataset and randomly select subsets of the variable at each step of decision trees. During inference, we get outputs from all the decision trees, and finally, we select the output which has maximum votes. Random forests are generally preferred over decision trees as they prevent overfitting.
Important Parameter/Concepts — Number of decision trees, Size of bootstrapped data, Number of random forest feature, and everything else mentioned in decision tree’s section.
Naive Bayes
This model requires a strong foundation in probability. Its working is based on the Bayes theorem.
![]()
Basically, we are trying to find out “What is the probability of a particular output (y) given an input (X)”. We assume that each input variable are independent of each other, so P(X|y) can be written as
![]()
Further, P(X) (present in the denominator) will remain the same for all possible output (0, 1). So we calculate P(y|X) for all the possible output, and the output with the highest probability will be the final prediction of the model.
Neural Network
One of the essential machine learning models nowadays. It is called a neural network because it is modeled after how the neurons in our brains work. The neural network finds patterns in the dataset, which sometimes even humans can not recognize. They are very powerful and can be of great use, especially when dealing with images, text, and audio.

In the above image, the first two circles represent the input layer, the middle column of 5 circles represents the hidden layer, and the last circle in yellow is the output layer. Each node in the hidden layers represents both a linear function and an activation function.
Important Parameter/Concepts — Learning rate, Loss function, backpropagation, activation function.
Regression
In regression, the output of the model is continuous. For example, consider house price prediction, where we predict the price of a house based on size and number of floors. This house price will be a continuos variable, not discrete.
Linear regression
It is similar to logistic regression. Here we try to find a line that best fits the data. This best-fit line is then used to make predictions about new data points.
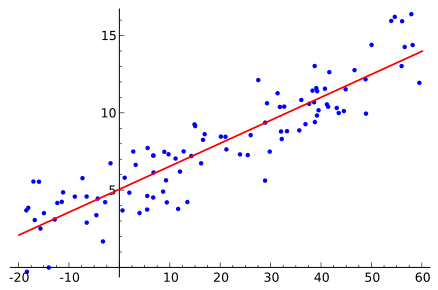
The linear regression is nothing but an equation of line or plane. This equation contains a coefficient for each input variable, reflecting each input variable's sensitivity towards the output.
Important Parameter/Concepts — Regression coefficient
Other important models which can be used for regression tasks are decision tree, random forest, neural network, etc. Since I have already covered them above, I will skip them now.
Unsupervised Learning
In unsupervised learning, the data that you use for training models is “Unlabeled”. This means you only have input. In unsupervised learning, we try to find patterns only based on input data. Two main methods used in unsupervised learning include clustering and dimensionality reduction.
Clustering

Clustering involves the grouping or clustering of data points based on some criteria. It is used for customer segmentation, fraud detection, document classification, etc.
Some common clustering techniques include k-means clustering, hierarchical clustering, mean shift clustering, and density-based clustering. While each technique uses different criteria in finding clusters, they all aim to achieve the same thing.
Dimensionality reduction
It involves reducing the number of input variables under consideration by finding/extracting a set of more important variables. There are two ways to reduce the input features by feature elimination or by feature extraction.
One of the most famous methods for dimensionality reduction is Principal Component Analysis (PCA) which is based on feature extraction.
Conclusion
I hope this attempt to summarize all the important machine learning models comes in handy for you all. If you think there is any scope of improvement or you want an explanation about any other model, please let me know. If you would like to keep yourself updated with more topics about machine learning,


Top comments (0)