
🌈G6 3.3 is released!
AntV G6 is an open source engine for graph visualization and analysis, which focuses on relational data.
Welcome to star our GitHub: https://github.com/antvis/G6
Our website: https://g6.antv.vision/en/
A graph is a set of objects and their relationships, which usually has large amount of data. In most cases, a graph is visualized as a large number of elements, including nodes and edges. And each element may be composed of multiple shape items, such as the most commonly used nodes with text labels. The performance of graphs' rendering and interaction have always been one of the most difficult problems in relational data visualization. Especially in the case of visualizing large graph by front-end with limited computing resources. How to improve the performance has become a major problem for G6.
At the beginning of 2020, we have finally taken the first step towards this problem: G6 3.3 with excellent performance has been released. Let's explore the secret of it!
The Engine
The main contributor to the improvement of G6's performance is the the upgraded basic rendering engine. The user interactions usually focus on the local region or elements, e.g. updating the styles of a node, dragging a node. Frequent rendering leads to bad performance and worse interaction experiment. So, our basic rendering engine utilizes「Local Rendering」 instead of global rendering to improve the performance.

What is local rendering? As the figure shown, we wish to update the filling color of the star shape to be green in figure a:
- Global rendering: re-render the whole canvas, which is in a rectangle with red border in figure b;
- Local rendering: calculate the bounding box of the shape to be updated firstly, which is the rectangle with red border in figure c. And then, only re-render the region in the red rectangle..
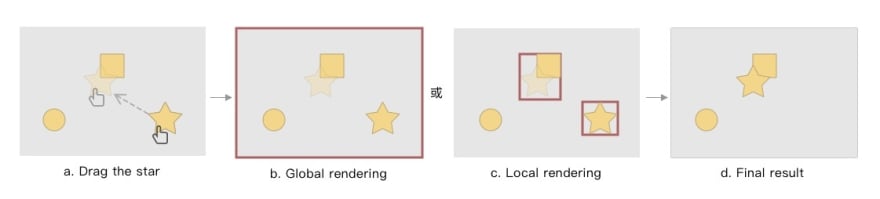
Similarly, dragging a shape causes the frequent rendering too. As shown above, when user drag a star, the local rendering only re-render the star shape and the shape(s) covered by it.
We all know that the efficiency of the Canvas rendering in front-end is very low. The local rendering mechanism improves it greatly by reducing the area to be re-rendered. Especially for the case of frequently update the local area of a graph with large amount of shapes. But we should admit that the calculation of bounding boxes also takes some extra cost.
Exercises
After knowing the engine and theory, let's step into the practical exercises.
Exercise 1
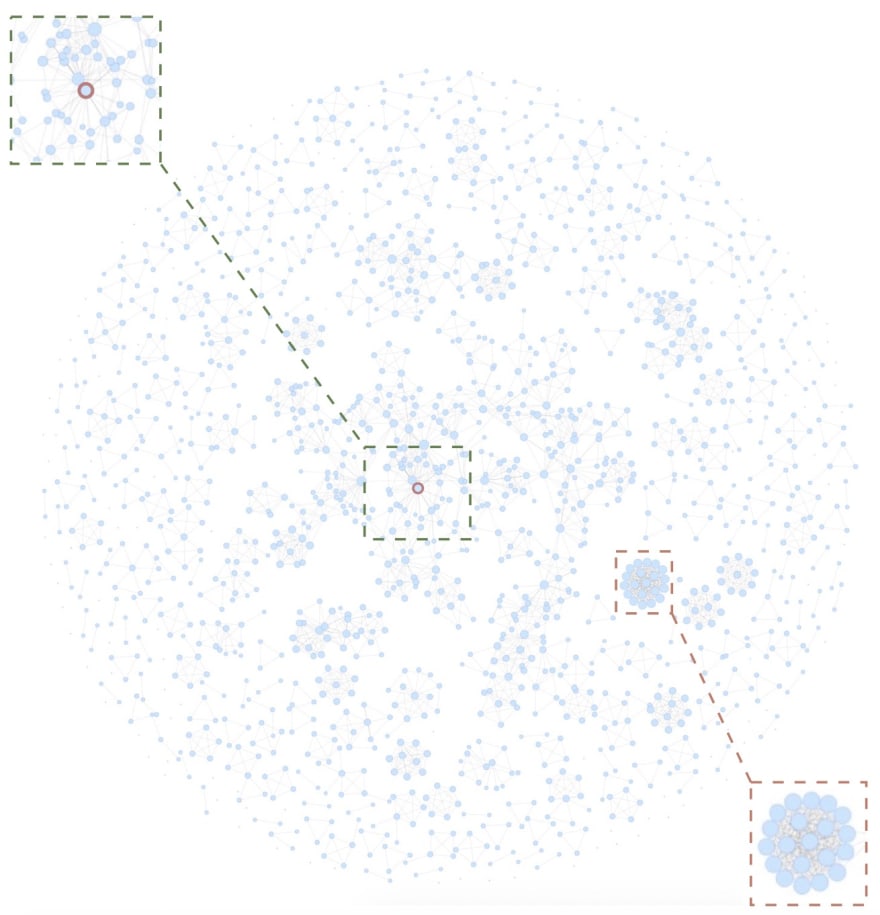
The data Net-Science has 1589 nodes and 2742 edges, which describes the collaborative relationships between paper authors. A node represents an author. If two authors have collaborations, the two corresponding nodes will be connected by an edge.
Overview
We first use G6 to visualize this data. The result is shown below. The sizes of the nodes are mapped to their degree. It is easy to find that there are lots of discrete nodes, which might represent the 'geeks' who work alone. There are also some other interesting sub-strucutres, such as the node with high degree in green rectangle, which might be an author who has lots of collaborations with others. And some cliques like the one in the red rectangle, which is a group of fully connected nodes, means the authors in the clique have close working relationships.
Users wish to explore these local structures by interaction, such as dragging a node to observe the related connections, dragging a group to re-arrange the positions, tagging the name of the nodes to better show the details, etc.
Experiment
To better show the detail information of the nodes, labels are placed around each node. It is known that the texts consumes a lot, and a node's label might be very long. If each node on the graph has a label, there will be 1,589 * 2 + 2,742 = 4331 shape items in the graph.
Now, we test the performance of dragging a single node and a group of nodes in G6 with this data. The result is shown in the gif below. Since the amount of this data is not so big, we find that the experience of the interaction on the versions < G6 3.2 is acceptable. But with carefully observation, we can find the dragged node(s) do(es) not follow the mouse well, and the FPS stays with a low value. But with G6 3.3, the interactions are smooth with high value of FPS.

Exercise 2
Data Eva has 8,343 nodes and 6,726 edges, which describes the ownerships between some American companies. A node represents a company. If company A owns company B, an edge exists between them.
Overview
Same as Exercise 1, we map the degree of each node to its size. The result is shown below. Except for the discrete nodes around the graph, there are lots of nodes with high degrees, whose neighbor nodes are laid around them radially. Users wish to drag some nodes to re-arrange the positions to get better observation with the structures.

Experiment
In this experiment, each node has a label. There are 8,343 * 2 + 6,726 = 23,412 shape items in this graph. Now, we try to drag a group of nodes to new positions. In previous versions, the responding time is too long to drag the group successfully. After several tries, the group finally moves slowly to the position where the mouse ended. This is an extremely bad interaction experiment for users. In contrast, G6 3.3 performs smoothly.

We compare the responding speed of mouse hovering. The node style will be changed to response the mouse entering and restored when mouse leaving. We find that G6 3.3 has higher responding speed and higher FPS value:

Exercise 3
The data in this exercise simulates a large scale system calling tree with 440 nodes and 439 edge. There are rich informations on each node representing a module in the system. Node A and node B is connected by an edge if there is a calling relationship between them.
Overview
As shown in the figure below, to better visualize the rich informations on the nodes and edges, each node is composed with 9 basic shape items, and each edge is composed with 3 basic shape items. That means there are 440 * 9 + 439 * 3 = 5277 shape items in this graph. 42% of them are texts which cost a lot. Besides, the edges are drawn as bezier curves, whose computations are more complex than straight lines. What's more, the bounding boxes of bezier curves are much larger, that is to say, the area to be locally rendered is larger.
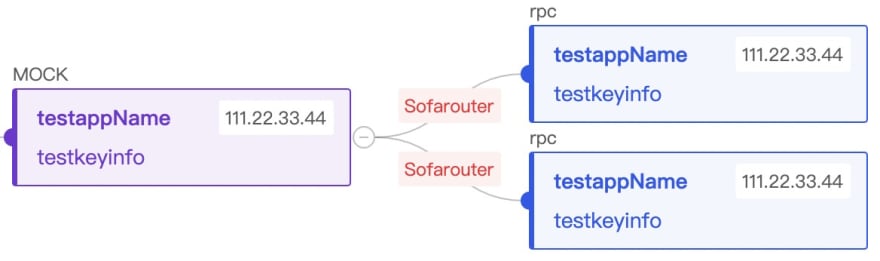
From the gif below we find that the graph takes a large space that hardly contains by one screen. Users have to explored it by interactions. When mouse goes into an edge or a node, its style will be changed to response the interaction. The sub-trees can be expanded or collapsed.

Experiment
Firstly, we compare the FPS when the mouse enters/leaves the edges and nodes.
- Hovering the edges: In previous versions, the speed of responding is very slow. The edges even did not response the hovering when the moving speed is too fast. The FPS is about 5.5~8.6fps; In G6 3.3, the responding speed is improved by local rendering and improvement of shapes' pickup algorithms. The FPS is about 12.9~22.6 fps.
- Hovering the nodes: In previous versions, the FPS is about 7.1~10.3 fps. And users can feel the stuck; In G6 3.3, the interaction is very smooth with FPS 23.4~32.5fps.
Secondly, we also compared the performance of expanding and collapsing the sub tree on the graph. In previous versions, the animation with 6.2~9.4fps of expanding/collapsing interaction looks stutter. In G6 3.3, the animation with 20.1~34.4fps is smoother.

We will do Better
Although the performance of G6 has been improved a lot, there is still a large space to be better. Such as reducing the unnecessary deep clone, optimizing the re-calculation for complex shapes, etc. We will keep moving to build up a better graph visualization engine.
About G6 3.3
Besides the improved performance, G6 3.3 also has these new features:
- Be refactored in TypeScript;
- Handle the situation that drag out of the canvas;
- More free configurations for elements and layouts;
- Richer building products.
G6 3.3 has made the first attempt to solve the performance problem, and it is more friendly for TS developers. See more detail here.
In the same time, it resolves the complex interaction situation. On the other hand, the community of G6 is expanding now. G6 will be more open and free to welcome more contributors.
Related Links
AntV G6 is an open source engine for graph visualization and analysis, which focuses on relational data.
Welcome to star our GitHub: https://github.com/antvis/G6
Our website: https://g6.antv.vision/en/


Top comments (0)