To measure the 'goodness of fit' of the line, when we do the linear regression analysis, Coefficient of Determination (R squared) could be calculated. R squared can measure how well our model explains the correlation. Here we measure percentage of variance explained by the linear model vs baseline model(in this case it is simply mean value of the target).
We can visualize it on the simple example. If we have some target, e.g. number of sales of the item during 5 days and we fitted a line. Now we want to check how good is our fit, basically how well we perform compare to naive prediction: calculating mean value of the sales.
from sklearn.metrics import r2_score
import numpy as np
import matplotlib.pyplot as plt

# given target
y_true = [5, 10, 11, 16, 19]

# base line
y_mean = [np.mean(y_true) for i in range(len(y_true))]

# fit a line
from sklearn import linear_model
X = [1, 2, 3, 4, 5]
X = np.asarray(X).reshape(-1, 1)
Y = y_true
model = linear_model.LinearRegression()
model.fit(X, Y)

print(model.intercept_)
print(model.coef_[0])
model_intercept = 2
model_coef = 3.4
# regression line
y_pred = [3.4*i+2 for i in range(1,(len(y_true))+1)]
# calculate R squared using formula
var_mean = sum([(y_true[i]-y_mean[i])**2 for i in range(len(y_true))])
var_pred = sum([(y_true[i]-y_pred[i])**2 for i in range(len(y_true))])
r2 = (var_mean-var_pred)/(var_mean)
print(r2)
0.9730639730639731
# calculate R squared using scikit learn
r2_score(y_true, y_pred)
0.9730639730639731
# calculate using pearson correlation
correlation = np.corrcoef(y_true, y_pred)[0][-1]
correlation**2
0.9730639730639731
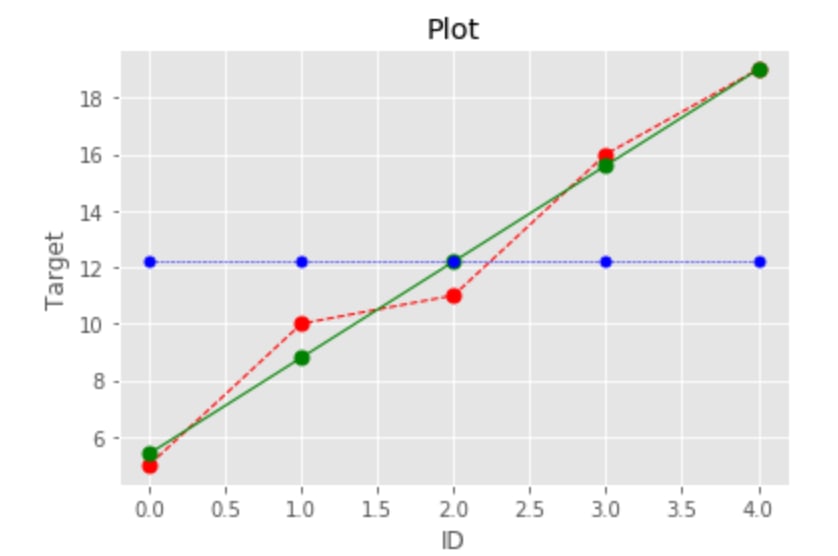
In this example regression line explained 97% better than just predicting mean value.


Top comments (0)