One critical requirement often flagged by Security and Audit is in App logging. For Power Apps this is a slightly grey area, there is a robust logging process available, but unfortunately it is outside of Power Platform in Azure App Insights. For some this will be an issue, as their IT dept may not allow easy access to App Insights. There is a workaround where a SharePoint list that can be used, but it will definitely have performance impacts, and enforce a lower level of logging.
If you do have access to App Insights, then logging is something you should be using, and is one of the first things you should plan before starting development. Adding logging retrospectively is anything but fun.
Im not going to cover request and setup of App Insights here, but I will Cover:-
- Setup App
- Traces
- Session References
- Logging Levels
- Quering the Data
- Visualising the Data
1. Setup App
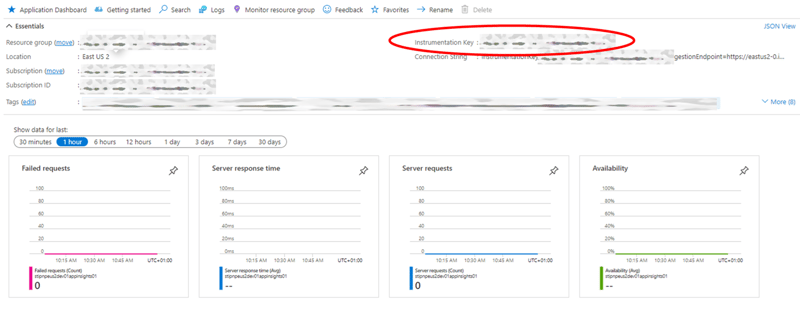
Once you have access to your app insights you need to get the Instrument key, as this is the link from App Insights to the Power App.
The Instrument Key should be entered in the App Object property window.
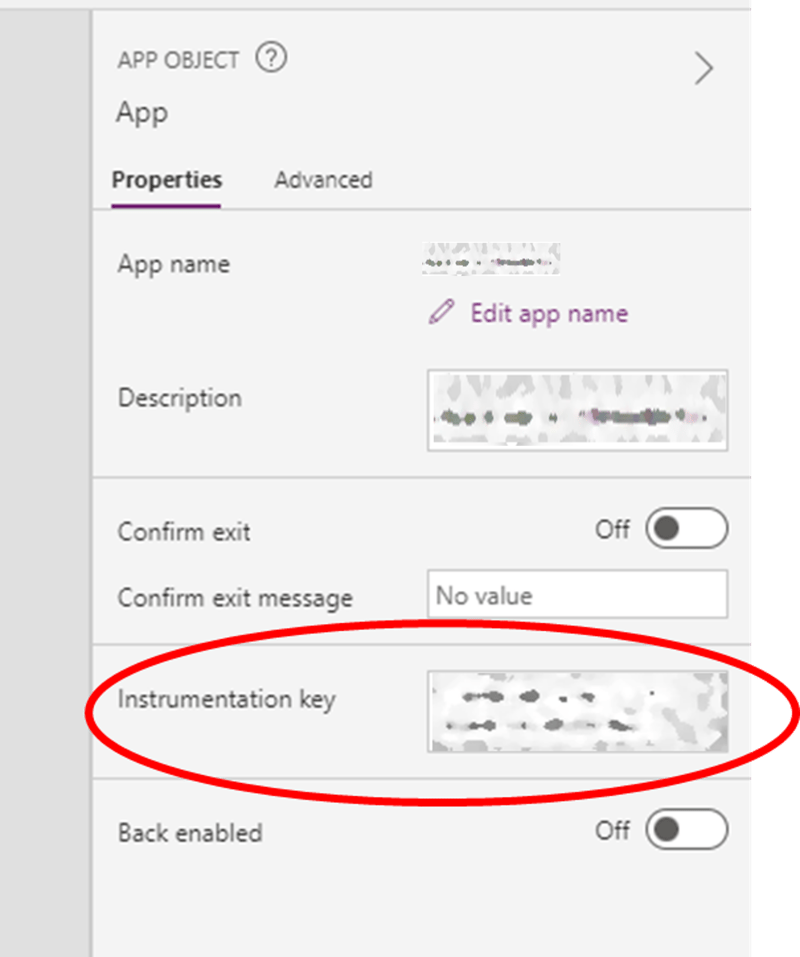
Unfortunately this value at present cant be stored in an Environment Variable, so would have to be manually updated each time the app is promoted from Dev to Test to Prod (if you have different App Insights per environment, which is recommended). Be warned if an incorrect instrument key is entered it may cause the app to fail to open.
2. Trace
Out of the box there are some default information passed to app insights, including screen changes, session starts and any system crashes. But this level of detail isn't enough for most logging, so this is where we use the Tracefunction. This allows you to add a row to the app logging on any action, including onSelect, onChange, OnVisible and more.
The Traceis structured as:
Trace(
   Message,
   TraceSeverity,
    {
      //custom dims object
    }
);
The Tracepassses 2 types of parameters/fields, standard and custom.
Standard
Some are set by the app and some are required to be set in the Trace (message and severityLevel). Examples of standard parameters are below (but not all).
| Parameter | Description |
|---|---|
| client_Browser | Chrome / Firefox etc |
| client_CountryOrRegion | Country |
| client_OS | Operating System |
| client_Type | Mobile / Browser etc |
| itemType | source e.g screen change / trace |
| message | message from trace |
| session_Id | User session ID |
| severityLevel | 1=Information, 2=Warning 3=Error |
| timestamp | DateTime of log |
Custom
Custom dims (custom dimensions) can be created inside the custom dims object, and are structured like a JSON, with the dim name followed by colon, and then the value.
Trace(
   "Log in",
   TraceSeverity.Information,
    {
        UserName: User().FullName,
        SessionRef: vsSessionRef,
        Milliseconds:tiQuery.Value*10
    }
);
The above example records user email, a session ref (see below), and the time a query took to complete.
As stated custom dims can be anything, but I generally recommend at least:
- User Email (if GDPR compliant)
- Session Ref
- Button/Input Name
- Query Parameters
- Query Result
- Query time
3. Session References
Session references are provided in Power Apps, but for a user to find them it isn't easy, and when reviewing logs in App Insights it really helps if the user can provide a session ref to filter the logs by. So I recommend to create your own session ref, that could be shown discreetly on the App screen, and used to filter the logging data.
To create a session ref a random 6 digit/character code can be generated. It doesn't need to be a GUID / unique, just unique enough that the odds of 2 identical session refs appearing in same date range is practically zero.
On the App onStart action add following code:
Set(vsSessionRef,
    Concat(
        FirstN( Shuffle(Split("QWERTYUIPASDFGHJKLZXCVBNMqwertyuiopasdfghjkzxcvbnmQWERTYUIPASDFGHJKLZXCVBNMqwertyuiopasdfghjkzxcvbnm234567890234567890£$%^&*()/<>?@{}~#\",""))
        ,
            6
        )
    ,
        Result
    )
);
vsSessionRef is the session ref that will be shown on a label on the app screen, the function:
- Splits a long string that has multiple different characters/digits/special characters into an array of single characters.
- Shuffle that array to randomise it
- Selects the first 6 characters
You can change the randomness by adding more characters to the original string and by increasing the session ref length
The session ref then can be passed as a custom dim in the Trace.
Trace(
   "Log in",
   TraceSeverity.Information,
    {
        UserEmail: User().Email,
        SessionRef: vsSessionRef
    }
);
4. Logging Levels
Over logging can have some negative impacts, like performance in the app, data storage in Azure, and ease of using the data. But it can be incredibly useful for debugging issues. A good practice is to have 2 levels, Max and Min, this is then set as an environment variable, as to have higher levels in Dev and Test, and lower in Prod.
Max
This records nearly all interactions, every button click, drop-down change, screen change.
Min
This is only key information, like log in, api queries, api results and other key info shown to the user.
5. Querying the Data
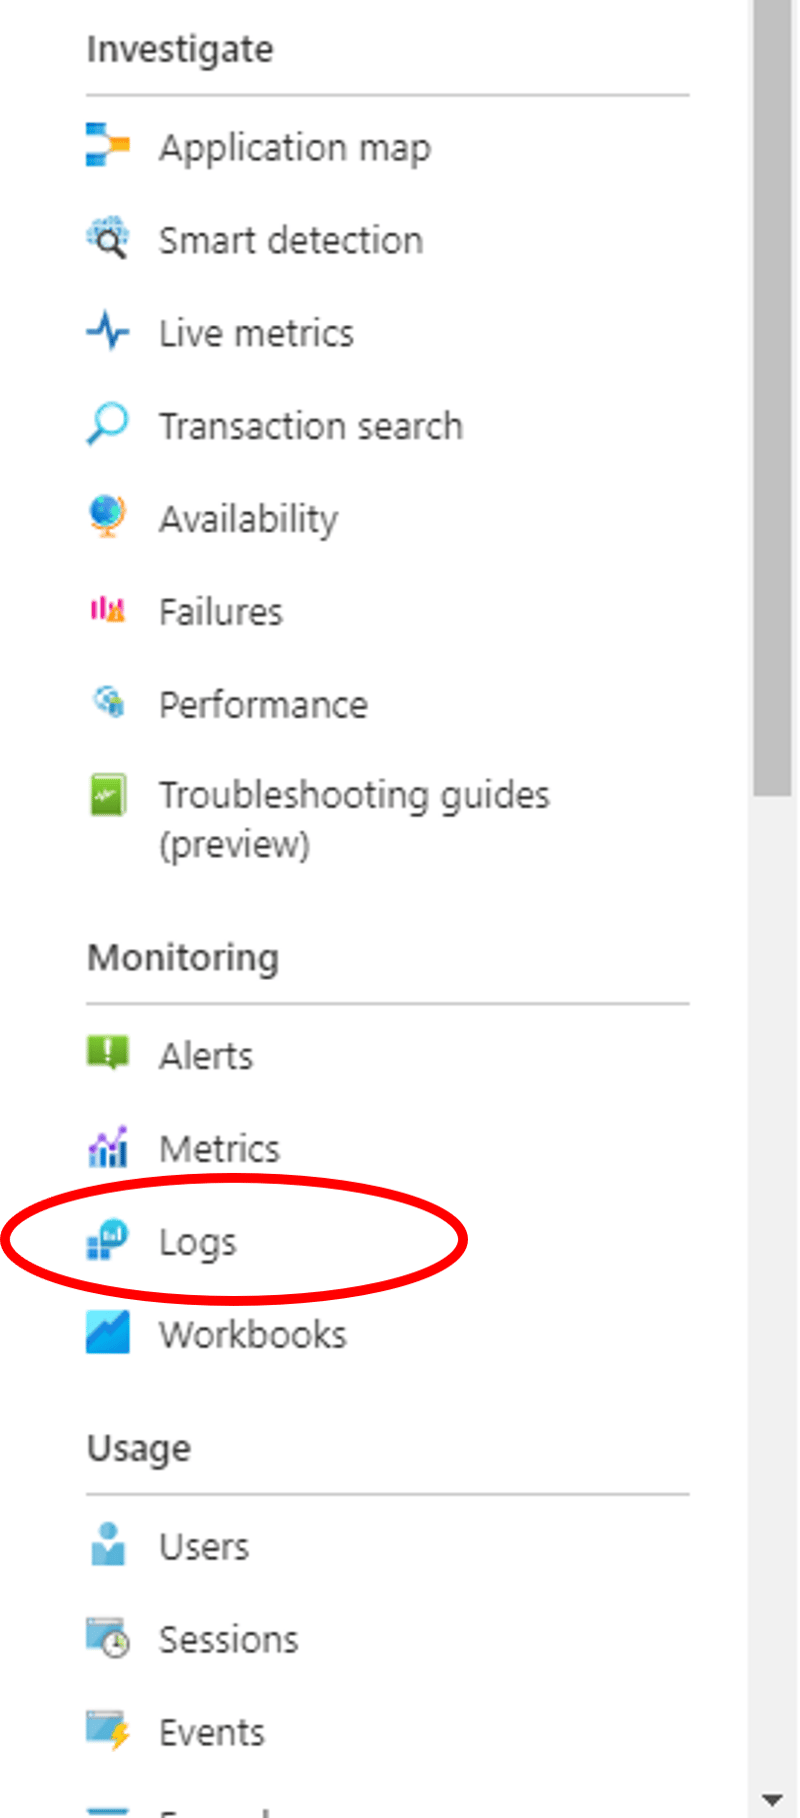
There are lots of different ways to explore the logging data inside App Insights, but the most useful is 'Logs'. As here you can run your own queries.
When launched there are some templated queries you can use, but to write your own you can simply close the popup window (that way you can use the custom dims you have created).
The Query should look something like this:
traces
| extend customdims = parse_json(customDimensions)
| where customDimensions.SessionRef =="3qzxjL"
| project timestamp
, message
, Email = customdims.UserEmail
, AppId = customdims.['ms-appId']
, OS = client_OS
| order by timestamp desc
The above uses the where clause and '==' to create to filter by the customdim SessionRef.
| Logic | Result |
|---|---|
| == | equals |
| != | not equal to |
| contains | contains string |
| startswith | starts with string |
| endswith | ends with string |
| and | Condition 1 And Condition 2 |
| or | Condition 1 Or Condition 2 |
To add more fields just add more commas.
traces
| extend customdims = parse_json(customDimensions)
| where customDimensions.SessionRef =="3qzxjL"
| project timestamp
, message
, Code = customdims.Code
, Query = customdims.Query
, Timer = customdims.Milliseconds
, Button = customdims.Button
, SessionRef = customdims.SessionRef
, Email = customdims.UserEmail
, AppId = customdims.['ms-appId']
, Location= client_CountryOrRegion
, OS = client_OS
| order by timestamp desc
There is built in intellisense to help build the query
At the end with use the order clause to sort the data how we want it.
The time span of the query can be updated top ribbon.
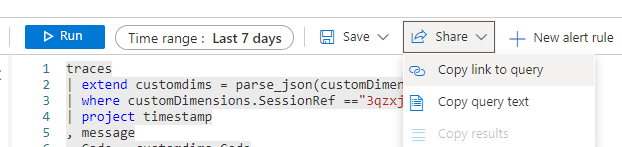
Additionally the query can be saved, or shared as a URL link or query text.
5. Visualise the Data
Once Ran you will see all the data in a table below the query, you can also export it to a csv, Excel or Power BI.
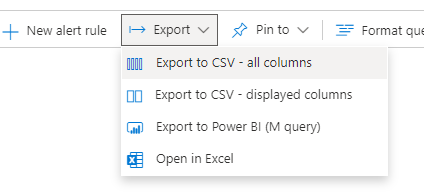
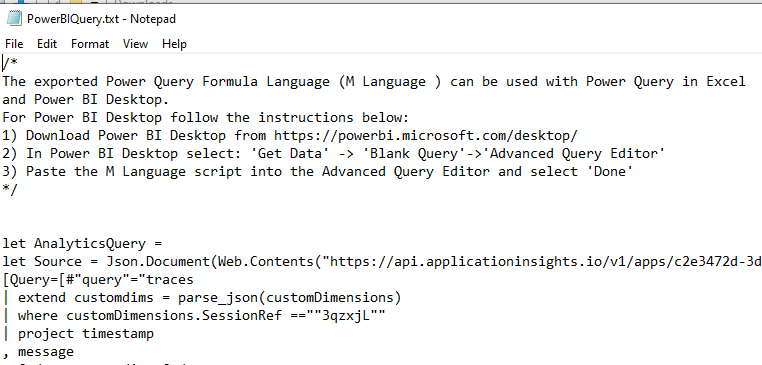
To export to Power BI you need to click 'Export to Power BI (M query)'. This will download a text file with the query you need to add to Power BI.
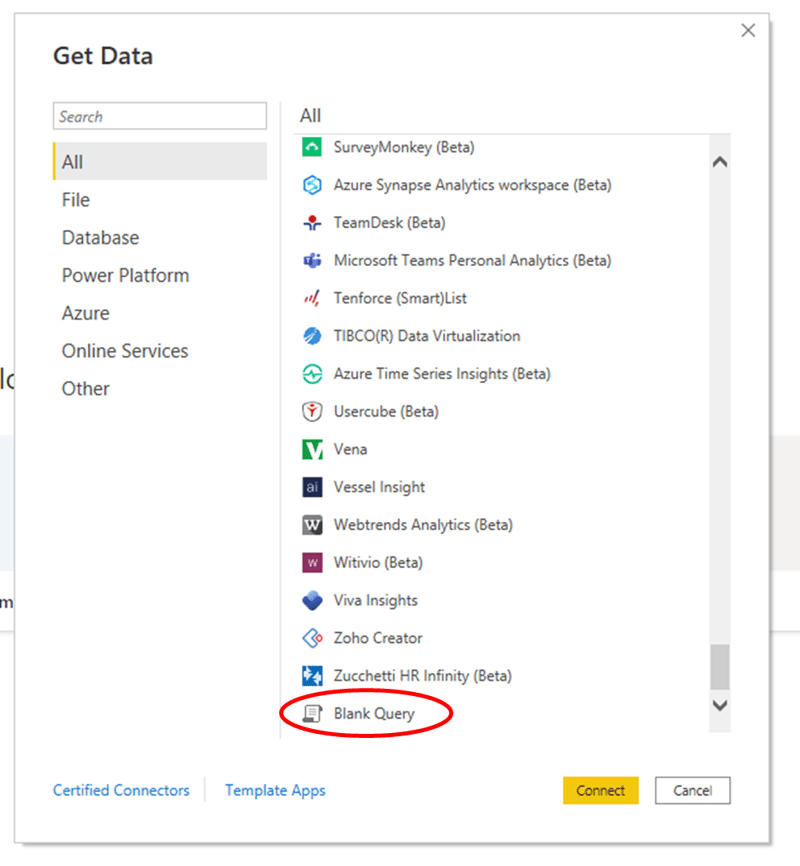
Then you need to open Power BI desktop and select 'Get Data' from 'Blank Query'.
In the Power Query Editor click 'Advance Editor', where a popup should open with a blank Query.
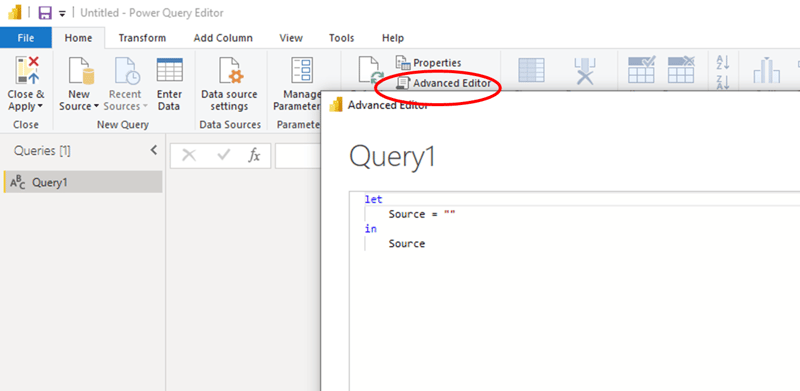
Paste over everything with the contents of the text file downloaded from App Insights.
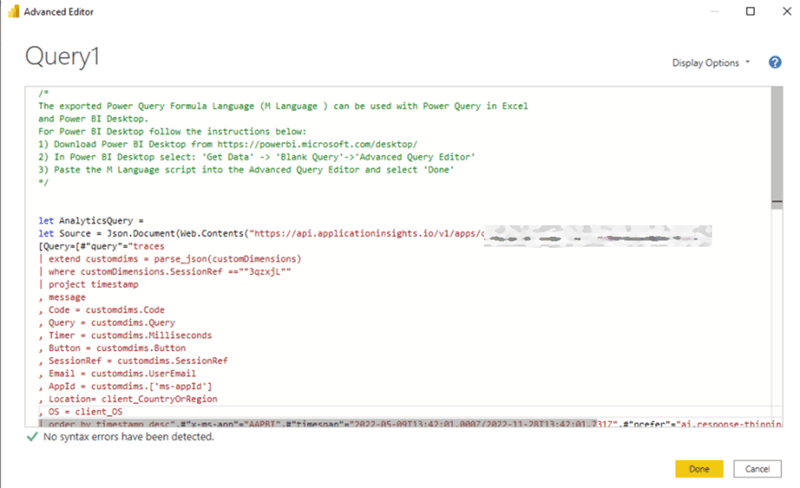
Be aware the query includes the data range you added, so a date far in the future is recommended
You may need to Edit Credentials and sign in before the data can be accessed.
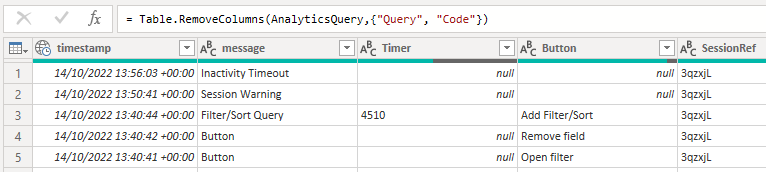
And that's it, the data should be connected to transform and create a report from.
Further Reading
https://learn.microsoft.com/en-us/power-apps/maker/canvas-apps/application-insights


Top comments (1)
Lovely the detailed steps on how to creating logging with Power platform. So often with the Low Code development operational element is ignored. It becomes difficult to triage when things break in production...