Since I was a little kid, diagrams have fascinated me.
As I grew as a software developer, I discovered how much more there is to them.

Diagrams are engineering tools
Diagrams are visually beautiful. They also embody the promise of a hidden, complex yet elegant mathematical underworld. An image can replace 1000 words – a diagram can replace 1000 ideas.
Diagrams are everywhere:
- business strategy
- chemical processes
- control systems
- project planning
- fantasy football
- category theory
- database schemas
- electrical circuits
- ...
Diagrams are not only omnipresent across disciplines. They are pervasive within disciplines. When we collaborate, ideate, and write documentation, we create diagrams. They are immediate and malleable.
Changing an arrow to point from A to B instead of C; drawing a box around E and E – a user can make drastic changes instantly.
That diagrams are ubiquitous is not a coincidence.
Diagrams are the way humans model the world
Diagrams are usually about the same size: five to ten objects connected by at most a dozen arrows. More complex relationships require nesting.
Us humans need abstraction to break things down into manageable amounts of "things."
Arrows compose: an arrow from A to B, followed by an arrow from B to C means that changing A will impact C.
We understand the world causally: if arrows didn't compose, the diagram wouldn't make sense.
Feedback loops are immediately visible. Participants with no formal background understand that something special is happening.
Research in category theory shows that many diagrams correspond to categories. Often, these are symmetric monoidal categories.
Diagrams allow us to work across disciplines
The implications are enormous. Engineers in one field can make significant contributions to other fields. They are experienced working with similar diagrams. Questioning what an arrow means in a state machine diagram, pointing out that a connection is missing: these are incredibly subtle and valuable insights. Yet people with no software background routinely make these observations.
Diagrams are powerful
Take diagrams seriously. They are the most powerful software engineering technique I know.
How do you use diagrams in your work?
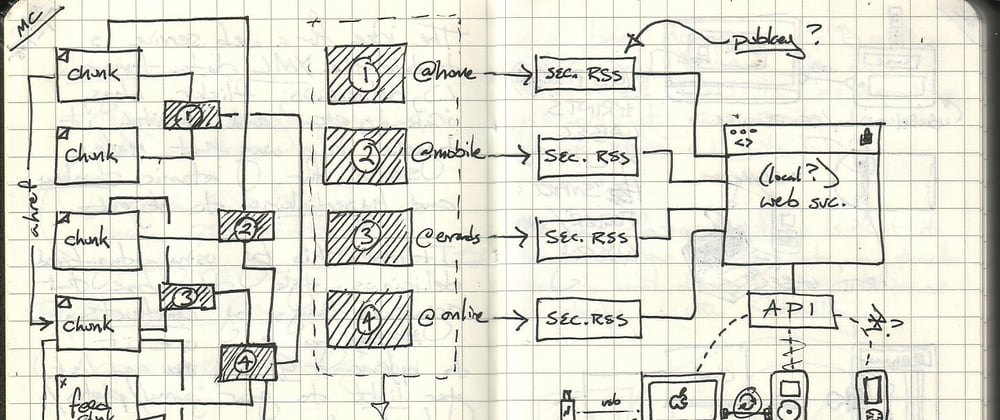
(Cover image by Jazz Di Mauro)


Top comments (22)
Almost agree, big issue with diagrams is that some people don't care about them and others take them as The Truth given by God, which creates a bunch of problems, especially because diagrams need to be updated, and as most docs they often aren't. Diagrams stop being connected to things they describe and no one ever has time to update them or knows how to update them (because they don't know how new version should look like).
Well said. A diagram needs to be derived from the code it describes and change along with it without requiring a heavy process outside of regular development... which was pretty much the thesis we had when we started the open source AppMap project.
I love the idea of AppMap.. I have always struggled on writing the docs of my code as I am this kind of people who finds it difficult to explain something.. a visual presentation would help for sure 😇
I do agree, diagrams in documentation are often out of date, and I tend to not use them that much. Tools like mermaid make it easier to keep things in sync, but it's still work (as good documentation always is).
I probably draw 100 diagrams for designing and engineering for every diagram I put into documentation :]
Good point!
Hello Manuel Odendahl,
Thank you for your article.
I like the length and the content is easy to understand.
As the "Diagrams are the ultimate engineering tool" theme suggests, it offers only a positive perspective, as expected.
I can't quite agree with the only positive opinion.
For example "Arrows compose: an arrow from A to B, followed by an arrow from B to C means that changing A will impact C.",
this depends on what kind of diagram it is. For example, the arrows in a UML class diagram are not intuitive to a novice.
Also, some companies have their own style of diagramms, and even those aren't exactly easy to understand. Among other things, I think it depends on the design selection for the various parts.
In summary, however, I agree that diagramms are extremely useful and often necessary.
For sure, diagrams are not "easy".
They do often require a good amount of experience in the field the diagrams are about, or in similar fields. They do however often function in a similar manner. If in a class diagram you have an arrow going from Job to QueueWorker to AbstractWorker to WorkerPool, it means there is some relation of jobs to worker pools. Similarly, in a data pipeline diagram, a connection from a user to a gateway to a S3 storage to the datalake makes it clear that user data is related to the datalake, even if the meaning of the arrows isn't exactly clear to say, a business analyst.
It is a good point to raise and I will try to go further into it in a future article!
Yup. Arrows are problematic when you are trying to represent control flow. Best to just avoid them... go with a line :-)
Why do you think arrows are problematic for control flow? I actually always use arrows (in every diagram), almost never just lines.
Arrows imply a simple, one directional relationship that doesn't provide a lot of value in terms of communicating how a system works. Arrows have their place of course (UML sequence diagrams spring to mind) but if you are not describing something simple like a request or a query they gloss over key relationships. This is probably why UML itself has a dozen or so styles of arrow to describe class relationships.
isn't indicating the direction of a relationship (which you of course need to ascribe some meaning) more useful than non directional? But I agree, the meaning of an arrow while it can be informal at times, needs to be shared amongst the participants. For flow contrl / state machines, I use arrows to mean "from this state, you can get to this state", and then potentially annotate the arrow with a condition that would cause that transition.
Were you referring to the * ... 1 annotations you can use in class diagrams?
Yup. At college we got sucked into the waterfall method which was pure hell and made me not care about diagrams. Later down my professional carreer I realised how much value diagrams provide in an agile setting.
Also very handy when mentoring team members because you can get them to understand the problem and solution without having to write code. Gives me a comfortable feeling after spending a good 30 min instead of pair programming, and doing most of it by myself.
I've been enjoying plantuml with markdown, and specially inkdrop with their vim plugin!
I agree, I like diagrams, but they are not easy to create. Most of the time, the question is what is the context and what do we assume others will understand so that it is apparent to those who try to interpret the diagram.. how do we do it? I would love to read an article about it from you
When you say they are not easy to create, what do you mean exactly? One thing I love about diagrams is that they are easy to create, and in fact most of the diagrams I draw are ephemeral. I draw them on the whiteboard or I create them with mermaid/plantuml in a pair programming session or in github comments, and then I discard them.
Documentation diagrams that are meant to be readable and long lived are indeed much more intensive. But compared to a well-written text that conveys the same information, the diagram is often faster and clearer. It is also easier to modify as the documentation needs to be adjusted.
yes, when you draw them on the whiteboard or at a pair programming session, it's easy, you have instant feedback and add the missing context as you go. but I'm talking about documentation type diagrams when you want to abstract a complex system without instant feedback and provide a good diagram for all the developers.. You can go crazy and create a too big diagram or a too small one and need to do the shapes, notes, colors, etc with clear representation especially if you do more than one diagram about a complex system.. This is what my last comment was about. Thanks for the reply.
I do agree with you @wesen , diagrams help a lot.
When you work on cloud platforms, you have to protect you application with security groups, kind of firewall rules. But when your platform becomes a little bit complex, it's difficult to analyze or troubleshoot all these rules. Because I like graphs and diagrams, I made a tool which help (at least me) to understand what is going wrong, for Openstack and AWS. I'm working now on the same kind of tool for GCP.
These tools do this kind of diagrams:
draw.io/ is my best friend to draw diagrams though.
I use other software before that most of the time needs some license cost associated with it.
To be honest, a simple tool like that does the job as well. And nice article. Diagrams are used everywhere in our company, from payment flows to showing of all our micro APIs.
If I'm honest, I would say 90% of my software work is actually drawing diagrams. The coding is fun, and takes the most time obviously, but it has become "secondary". The diagrams determine if a project is going to fulfill the business and if the software architecture will work out.
Have a look at: c4model.com/
Never seen a write up about diagram this inviting. I think my phobia for diagrams just got cured after reading this
thank you so much, this means a lot to me! diagrams are fun!