So as part of our geospatial strategy we have at LOCALLY we have a huge database of POI’s, as part of this we have started to merge this with our library of geofences allowing us to get more granular control and perform things such as a dwell time calculations to help provide more value to our data.
Creating a test dataset:
Now the data we usually use is pretty huge, my test database alone is over 150GB and we don't have time to wait around all day while calculations happen on our local machines so the trick is to create a small and individually verifiable dataset to create a proof of concept for the larger whole.
We have a dataset for the District Of Columbia in the US:
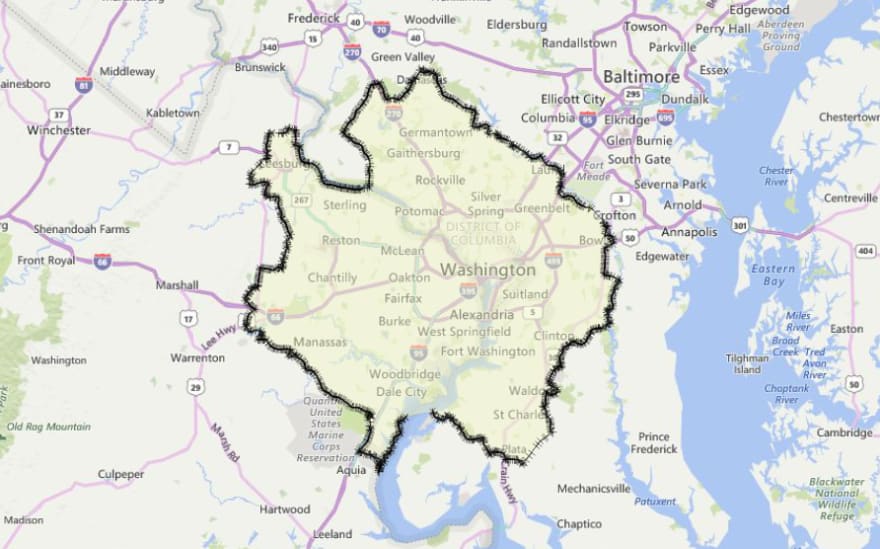
Now - even with this super restricted data set it will still take a large amount of time to perform calculations in QGIS with the huge number of vertices of that surrounding polygon, so to make things simple I use the Geoprocessing tools in QGIS to “simplify” this polygon:
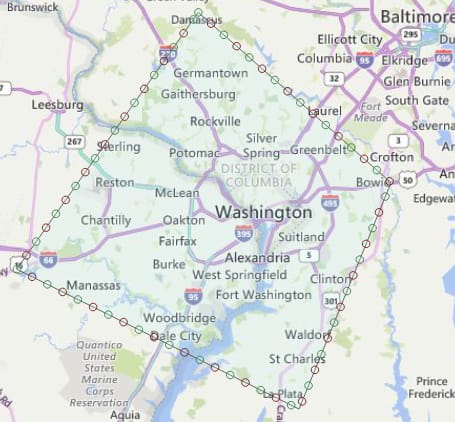
(You can also do this by hand).
Now we have a simplified polygon we can overlay our POI database to get an idea of how much data we are going to be working with:
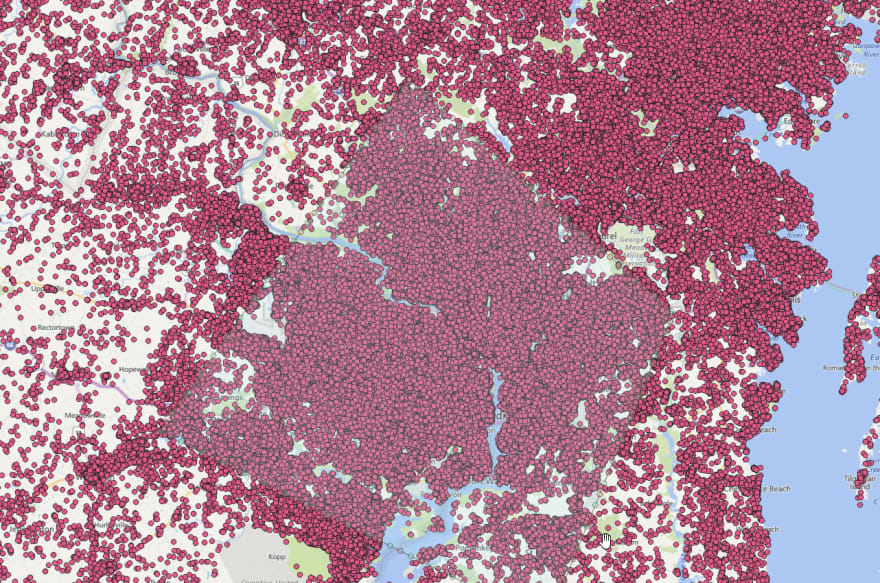
Yep as expected this is a pretty huge amount, we are actually only interested in a very tiny subset of these (which I will describe later) but this needs to be an iterative process in order to not end up with a 24 hour join on the final dataset.
So first lets discard anything outside of the simplified polygon we have created, we can do this using the “Clip” functionality in QGIS:
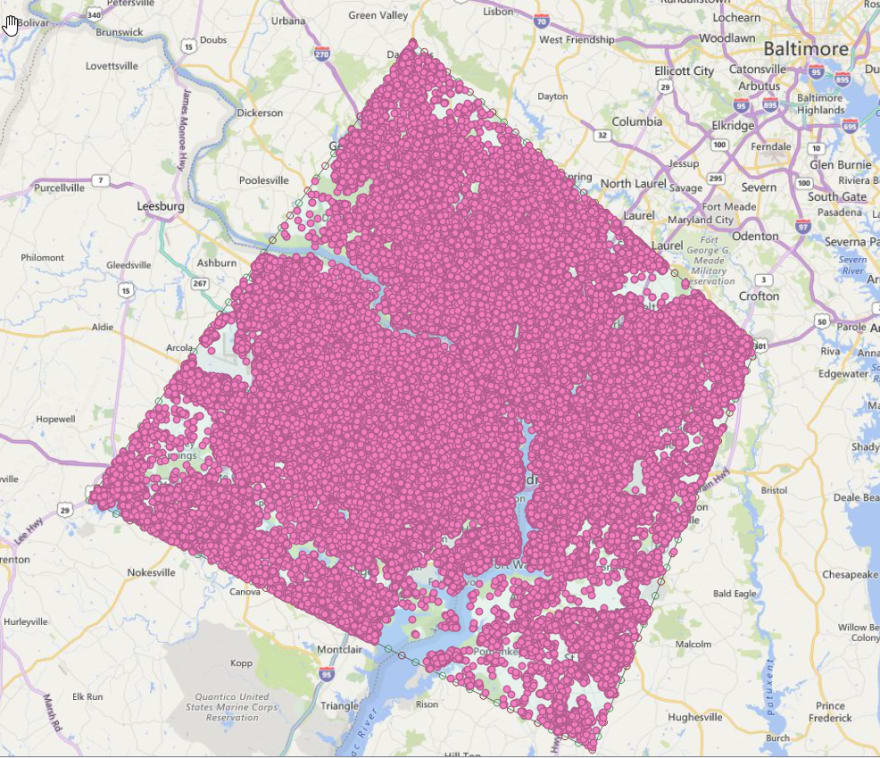
Much better. So now this brings us onto how we manage the Geofencing aspect. These pink circles represent every single point POI within the DC Metro (ish) area, however points are just that - single points. We can tell whether a device gets near to a point but we cant really signal intent from that action. This is where we need Geofences. So we have our database of building Geofences we have created for items that interest us
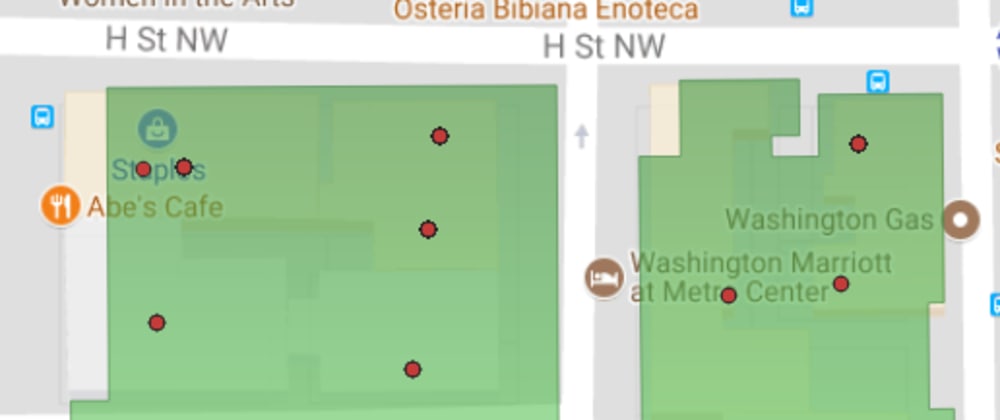
So in this case lets take our Geofences from near the Washington Capitol Building (ignore the non-matching Geofences - the underlying map is different but I wanted the labels):
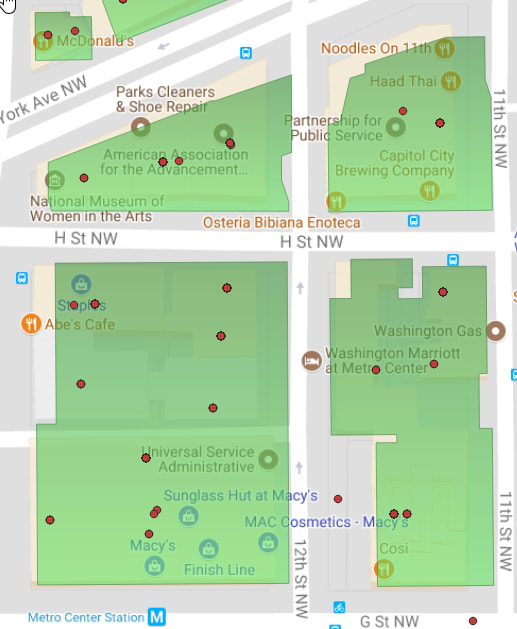
Each of these buildings here represent some foot traffic locations that we can use as our proof of concept.
Not every POI is aligned with a Geofence of a building, there are 2 ways we can handle this:
- Create an inverse dataset that creates a new layer for any point NOT inside a Geofence and then create a small radius around these as a self contained Geofence.
- Use a nearest-neighbour function search to approximate their locations.
Actually we will need to do both in a fashion depending on the data but that is outside of the scope of this. For now lets just focus on the items that ARE inside the Geofences. We can see that on the left is the Washington Marriot, the red dot to the right of that is the POI point that shows this.
From this now we can do a join within QGIS to create a new dataset that has the attributes joined:
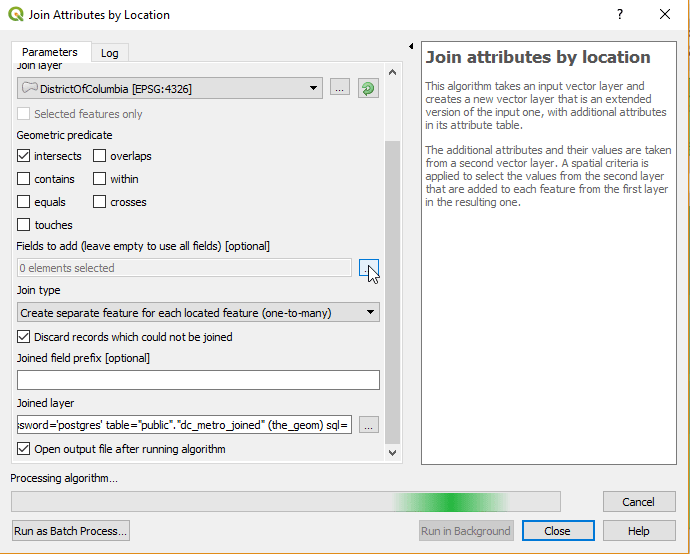
This will now create a new table in my local test database that contains all of the information of the POI with a join to the Polygon ID it is contained it, with the create separate features for each located features this will also mean that there will be several items per polygon, internally we use proprietary methods to identify separate boundaries for each of these locations thereby splitting up the single polygon into multiple polygons containing individual POI’s.

|
Daniel Voyce - CTO Daniel leads the technology strategy, architecture and development at LOCALLY.
|


Top comments (0)